| Forex forecast 12/16/2020 on EUR/USD, USD/CAD and Gold from Sebastian Seliga 2020-12-16 Let's take a look at the EUR/USD, USD/CAD and Gold technical picture ahead of the FOMC interest rate decision and press conference. Simplified wave analysis and forecast of GBP/USD and USD/JPY on December 16 2020-12-16 GBP/USD Analysis: The upward trend that began in March continues on the British pound market. The price is approaching the lower edge of the preliminary target zone. After an intermediate correction, a new section of the pulse develops on the chart. forecast: Today, the general upward course of movement is expected. in the European session, there is a possibility of a short-term decline or a sideways flat. By the end of the day, you can expect a resumption of price growth up to the calculated resistance. Potential reversal zones Resistance: - 1.3640/1.3670 Support: - 1.3500/1.3470 Recommendations: Today, there are no conditions for selling the British pound. It is recommended to track signals for buying the pair at the end of any downward movements.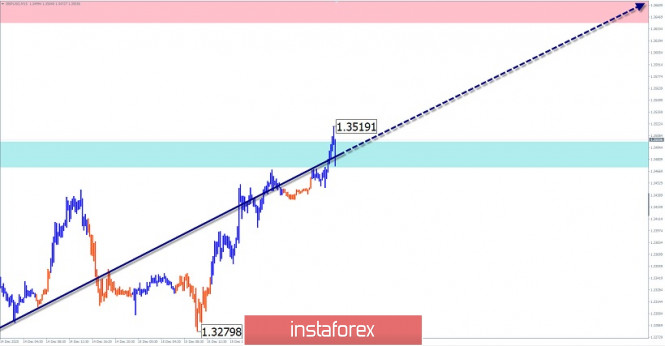 USD/JPY Analysis: The Japanese yen's major chart is dominated by a bearish trend for most of this year. Its last section counts down from November 9. The wave has entered the final phase and is approaching the upper limit of the potential reversal position of a large TF. Forecast: Today, the pair's market is expected to be generally bearish. Short-term price spikes, no further than the resistance zone, are not excluded. Potential reversal zones Resistance: - 103.50/103.80 Support: - 102.80/102.50 recommendations: Buying yen today can be unprofitable. Trading on the pair's market today is recommended only in the direction of the dominant trend. 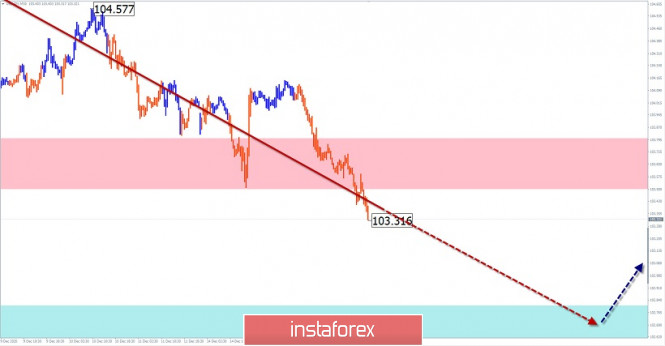
Explanation: In the simplified wave analysis (UVA), waves consist of 3 parts (A-B-C). The last incomplete wave is analyzed. The solid background of the arrows shows the formed structure, and the dotted one shows the expected movements. Attention: The wave algorithm does not take into account the duration of the instrument's movements in time! Analysis for GBP/USD on December 16. A deal is unlikely says Boris Johnson 2020-12-16 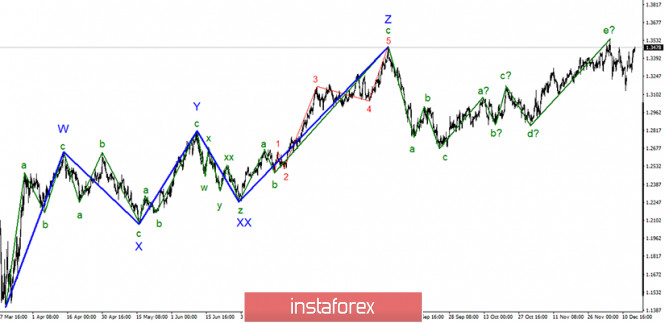 The wave pattern seems to indicate that the upward trend is already completed. As a result, a five-wave ascending structure of the trend was formed. At the same time, the global descending section of the trend already completed its formation, so the upward section of the trend can resume its formation from the current positions. A successful attempt to break the high of the supposed wave e will indicate the readiness of the instrument for further growth. 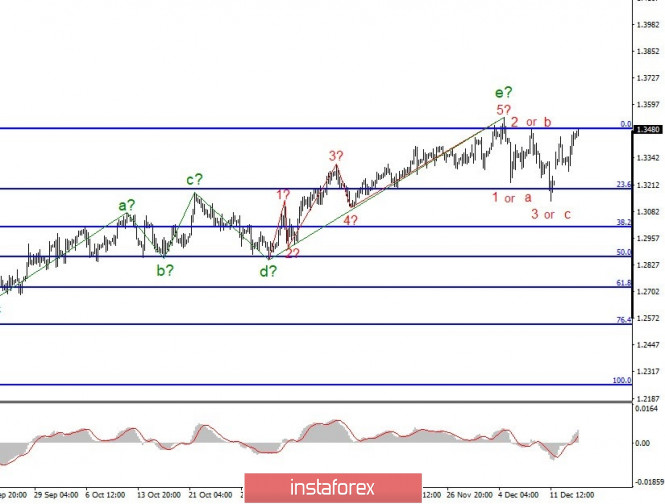 The wave pattern in a lower time frame clearly shows the three-wave section of the trend, which formed after the completion of wave "e". Consequently, the pair continued its strong upward movement, adding almost 400 pips. On the other hand, it is unlikely that waves d and e will form, but there are high chances of building a new upward trend or complicating the old one. Thus, a successful attempt to break the high of wave e is likely to complicate the upward set of waves again. We are fast approaching the upcoming year, which makes the current year a history in two weeks. However, there has been no progress on the trade agreement between the EU and the UK. The time is already running out and so, it is very possible that the parties will not have time to either agree or ratify the agreement. But another option is still available, that is, the parties will be able to sign a "raw" deal before this year ends and just somehow accept it, bypassing the approval of all EU member states. However, the likelihood of this option is also disappearing every day. Yesterday, Boris Johnson reiterated that the most possible result of the trade deal is "no-deal". Government officials say the Prime Minister wants an agreement, but not at any cost. He said a dozen times that the future agreement must respect the interests and independence of the UK. Here, nothing still changed even in the rhetoric of the negotiators. Tonight marks the end of the Fed meeting, and its results may affect all instruments with the dollar. Perhaps, its influence already begun, since the euro and the pound simultaneously quickly rose this morning. Thus, the markets may not expect any optimistic information from the FOMC or maybe they don't need this information at all. The pound and euro are rising without any problems and without the news background. Yesterday's UK reports had no impact on the markets. The same case is likely with today's UK and US statistics. General conclusions and recommendations: The pound/dollar pair has supposedly completed the formation of the upward trend section. I recommend that you sell the instrument following each new MACD sell signal with targets located near the levels of 1.3190 and 1.3008, which corresponds to the 23.6% and 38.2% Fibonacci levels, before a successful attempt to break through the 0.0% Fibonacci level or the high of wave "e". A successful attempt to break through the 0.0% Fibonacci level will indicate another complexity in the upward trend section, which will negate the scenario of selling the instrument. In this case, this will lead to a more complicated wave pattern. Forecast for EUR/USD, December 16, 2020 2020-12-16 Market participants are awaiting the results of the two-day Fed's meeting Hi everyone! The situation with the coronavirus can hardly be called resolved as the virus continues to spread. The United States of America, India, and Brazil are the countries with the highest rate of infection spread. They register the biggest daily number of new coronavirus cases. The epidemiological situation in Europe is also worrying. A number of European states have introduced new restrictions. For instance, in Germany, only food stores and pharmacies are open, other shops are closed. France replaced its stay-at-home order with a curfew from 8 pm to 6 am. Europe remains the world's most infected region with more than 20 million people tested positive with the coronavirus since the outbreak of the pandemic. Market participants are waiting for the results of the two-day meeting of the US Federal Reserve System. Today, at 22:00 (Moscow time), the Federal Reserve will announce its policy decision, new economic forecasts. At 22:30 Moscow time, Fed Chairman Jerome Powell will deliver a speech at a press conference. As expected, the Fed will not change the benchmark rate. It will keep the key rate at current values. At the same time, the central bank will once again confirm that rates will remain near zero for a long period of time. Besides, the Fed is likely to confirm the continuation of its large-scale bond-buying program. Weekly analysis 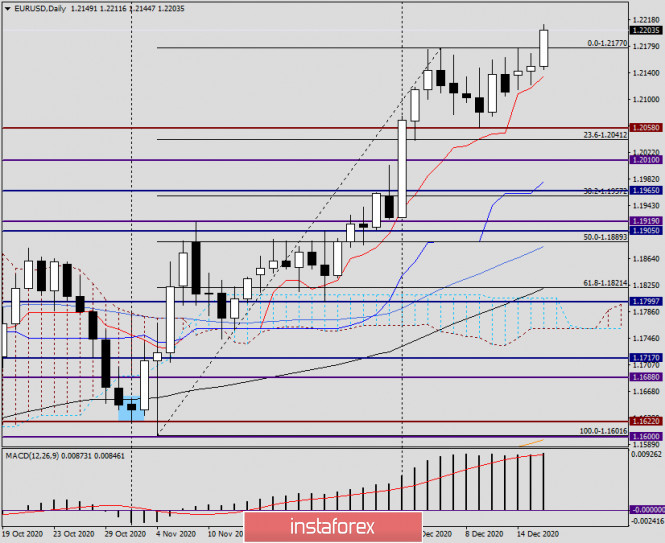
Let us look at the technical analysis of the EUR/USD pair on the daily timeframe. It is clearly seen that after a strong upward momentum, starting from December 3, the EUR/USD pair was trading in a relatively narrow range of 1.2058-1.2177. As a rule, when the pair trades in such ranges, it enters the consolidation phase preparing for a new robust increase. Usually, such a hike coincides with the previous direction. Today, the euro/dollar pair began to move up from the designated range, thereby confirming its previous growth and signaling its continuation. At the moment of writing this analysis, EUR/USD broke the upper trend line, which is the level of 1.2177. If today's trading ends with the formation of a large white candle with a closing price significantly higher than this level, the pair is likely to break above this level. When the pair rollbacks to 1.2180-1.2160, it is recommended to open long deals. H4 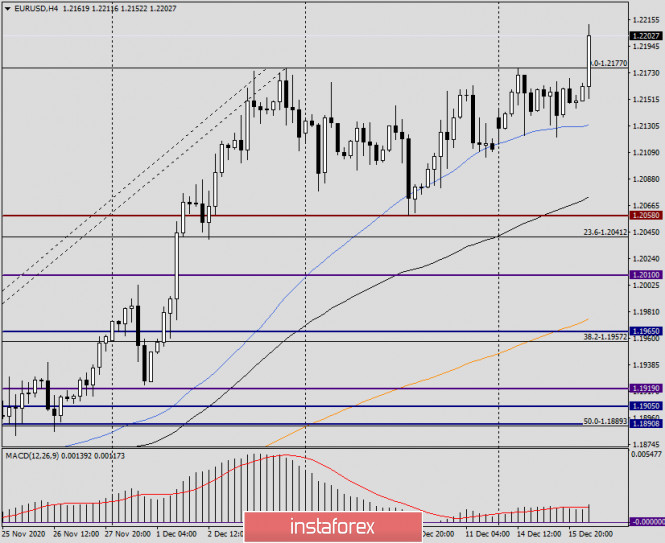
On the H4 chart, we can clearly the range of 1.2058-1.2177 and the breakdown of its upper trend line. In my opinion, long deals on the pair should be opened after a pullback to the area of the broken upper border of 1.2177. If the pair with three candles in a row consolidates above the level of 1.2200, it is recommended to open long deals near 1.2200. The man risks for today's trading are associated with the results of the two-day Fed's meeting. Experts are uncertain what decision the Fed will make and most importantly, how traders will react to it. It is better to remain cautious. Analysts of EUR/USD for December 16. Fed policy meeting unlikely to spring surprise 2020-12-16 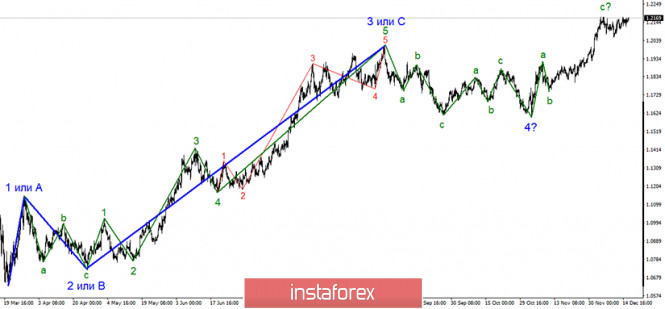 The wave layout of EUR/USD still indicates that the uptrend is underway. The upward wave labeled as c is still in progress. The wave has made a successful attempt to break the high of wave 3 or C. The ongoing section of the uptrend could evolve into a 5-wave layout because three waves have been already completed. In this case, the whole wave structure is getting a bit complicated. Nevertheless, this layout signals that the price is about to reverse downwards soon. 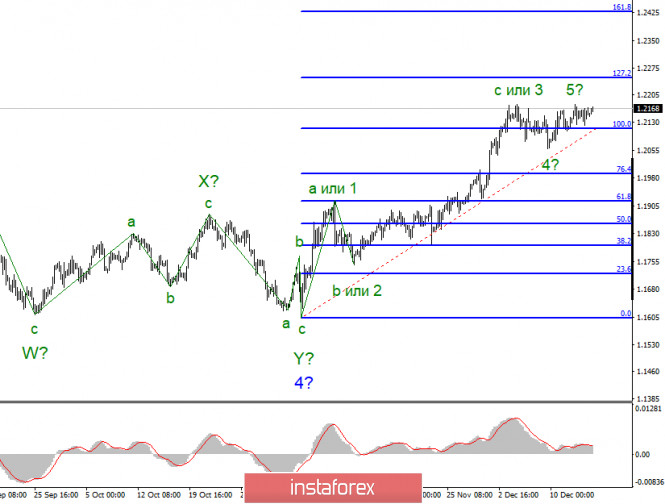 The wave layout of a shorter time frame also indicates a further uptrend. I also admit a scenario that the wave layout, which came into being on November 4, could turn into a 5-wave structure. Meanwhile, a minor climb from highs and the bullish outlook confirm that traders are ready to go on buying EUR/USD. So, I added waves 4 and 5 to the wave layout. Yesterday, there were no market-moving events for EUR/USD. So, the currency pair was trading in a quiet market. Today, plenty of news is on investors' radars. Looking at technical charts, anyone can spot a cluster of upward waves which suggests the bullish outlook. You may wonder why markets maintain buoyant demand for EUR and low demand for USD. This is a rhetorical question as no one can answer it precisely and squarely. Thus, it would be better to shift focus towards the economic calendar. For example, today investors are alert to a series of PMIs on different sectors in the EU and the US. All forecasts signal nearly flat readings close to the scores in the previous month. For your reference, the eurozone's services PMI sank below the threshold mark of 50.0. Interestingly, business activity in the US service sector is firmly in the expansion territory. In contrast, the EU service sector is going through a downturn that is a precursor of serious economic headwinds. Oddly enough, EUR has been unaffected by downbeat statistics. Today, the US Federal Reserve is going to wind up its two-day policy meeting. The policymakers will hardly spring a surprise. Most experts share the viewpoint that the Fed's final policy meeting of 2020 will not end up with crucial policy updates. What can Jerome Powell and his team actually do right now? It doesn't make sense to raise/lower interest rates. The QE program has been already swollen to an unprecedented extent. So, they will hardly expand it even more. The market is interested to find out official forecasts of economic prospects in the medium term. The policy statement will contain such forecasts. Besides, investors will take notice of Jerome Powell comments at the press conference. His remarks are to shape market sentiment. Conclusions and trading tips Apparently, EUR/USD is carrying on forming the uptrend section. In fact, the price is creeping upwards from earlier highs. Thus, I would recommend being cautious about buying the currency pair. Nevertheless, it is too early to say that a cluster of upwards waves has completed. In the meantime, traders still can buy the pair cautiously at every signal of the MACD indicator with the upward target at near 1.2250 which is equal 127.2% Fibonacci correction. Please beware there are the odds that the upward trend is about to complete in the nearest future. Trading plan for the EUR/USD pair on December 16. Global COVID-19 incidence increased again. 2020-12-16 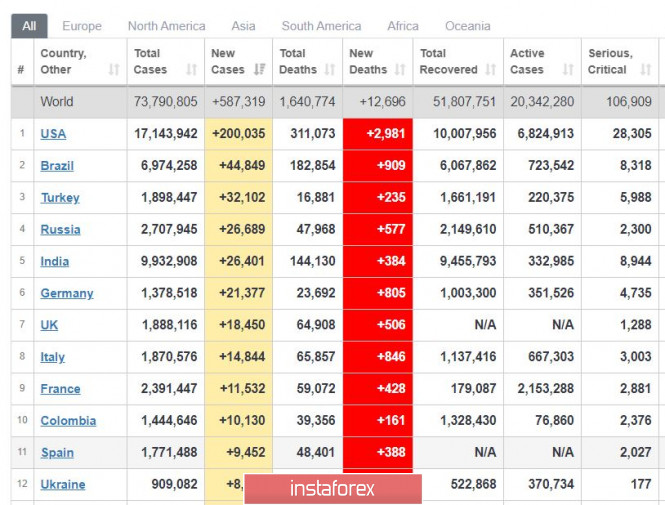
Global COVID-19 incidence has increased again, but the figure is still below the recorded peak. In the United States, the number of new infections is again around 200,000 a day. Tougher measures were also introduced in Germany today because of the increased infections. But in other parts of Europe, the situation is relatively good - the number of new patients are well below the peak. Going back to the US, vaccinations are in full swing, but the effect should not be expected until mid-January. 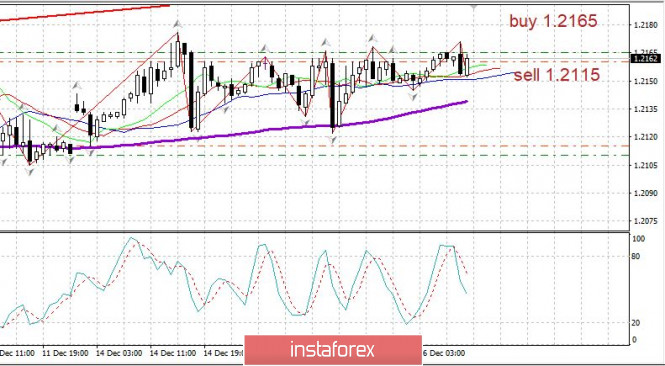
EUR / USD- the euro is trading in a narrow range ahead of the Fed meeting today. During the meeting, the Fed will discuss new economic forecasts, as well as reports on employment and inflation. Open long positions from 1.2175. Open short positions from 1.2115. In long positions, place stop loss at 1.2115. Gold has all the advantage against Silver 2020-12-16  Most analysts believe that it is more profitable to invest in gold than in silver, since the yellow metal makes sure that its owners have higher profitability compared to the gray one. As a result, investors are favoring gold more. The yellow metal has been a "safe haven" asset for decades, guaranteeing the protection of capital from the impact of negative political and economic factors. Analysts are confident that these functions of the indicated metal will remain in force. Despite some volatility of the precious metals market, it remains stable and is very popular with investors. Silver, although not as popular as gold, is also noticed by market participants. Nevertheless, experts recommend having some silver. Experts pay attention to the advantages and disadvantages of owning both metals, which should be taken into account by investors. Considering the ratio of the value of gold and silver, purchasing silver coins has certain disadvantages in the current condition. Analysts note the following: - Silver takes up more space than gold. More free space is necessary to store it than purchasing gold for the same amount.
- Experts believe that the price of silver is much more volatile than that of gold. The current high ratio of the cost of both precious metals is in favor of the yellow metal. According to analysts, this fact confirms the high protective properties of gold compared to silver.
- Silver is not usually used as an investment asset in the modern society. Many investors don't see silver as a defensive asset either. As a result, it sells worse and brings less profit than gold.
Gold is at the peak of its popularity these days. Last night, New York Stock Exchange Gold futures closed at their highest level in the past week. Gold futures for February delivery rose 1.3% to $ 1,853 an ounce, while silver futures for March delivery rose 2.5% to $ 24.64 an ounce. Today, gold continues to maintain its gains, trading near $ 1,854 per ounce. 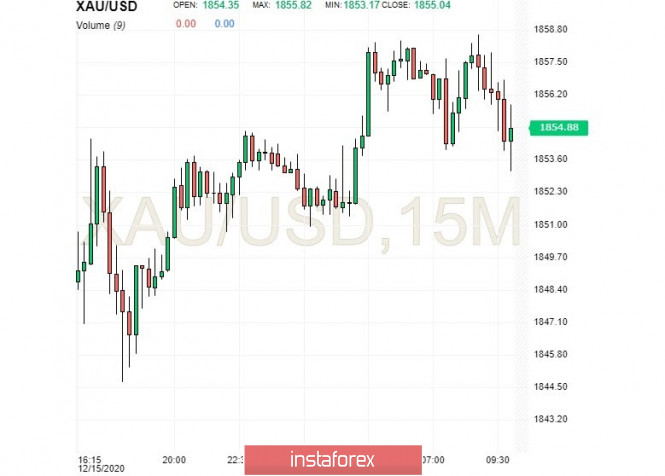 According to experts, the growth of gold's quotes is because of US Congress possible adoption of an additional package of fiscal stimulus. There is a possibility that this will be confirmed before the end of 2020. The next $ 748 billion fiscal stimulus package, proposed by two parties of Congress, includes such support measures as the payment of weekly unemployment benefits and financial assistance to a number of companies. Economists estimate that the new fiscal stimulus program is very important for the yellow metal. Experts are confident that this will be able to support the precious metal in the short and medium term. At the same time, an increase in the state budget deficit during the program for buying US government bonds contributes to the dollar's further weakening, which is beneficial for gold. Analysts emphasized that gold remains the winner in the current condition. It is clear that the gold outweighs silver on the scale where both metals are located. Gold has a new stimulus package on its side, while silver does not have that advantage. Moreover, it can be concluded that gold's growth is not hindered even by negative factors such as the reduction in its purchases from exchange-traded funds and the successful introduction of vaccines against COVID-19. Technical analysis of EUR/USD for December 16, 2020 2020-12-16 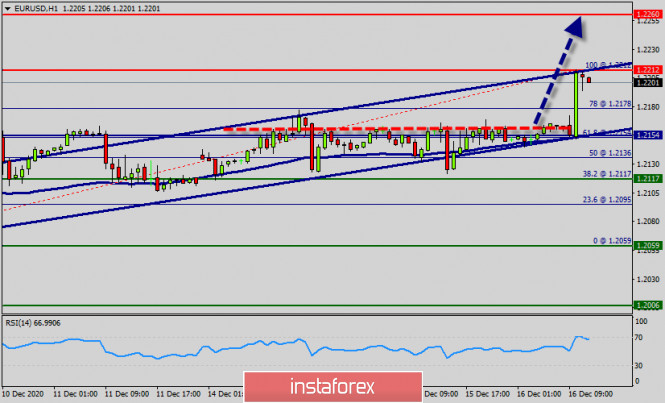 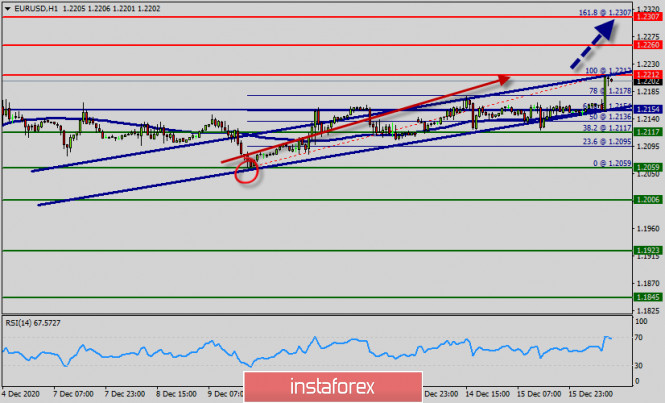 Overview : The EURUSD pair, after the attempt to move to recent highs hit the 1.2212 and retraced back around the spot of 1.2190. The price is after the move in a descending channel is now moving in an ascending one. The EUR/USD pair leaps above the level of 1.2154, highest since April 2018, amid growing market optimism. On the one-hour chart, the EUR/USD pair continues moving in a bullish trend from the support levels of 1.2117 and 1.2154. Currently, the price is in a bullish channel. This is confirmed by the RSI indicator signaling that we are still in a bullish trending market. As the price is still above the moving average (100), immediate support is seen at 1.2154, which coincides with a golden ratio (61.8% of Fibonacci). Consequently, the first support is set at the level of 1.2154. So, the market is likely to show signs of a bullish trend around the spot of 1.2154. In other words, buy orders are recommended above the golden ratio (1.2154) with the first target at the level of 1.2212 ( we should see the pair climbing towards the double top (1.0255) to test it.). Further rally could be seen to cluster resistance at 1.0255 next, (100% retracement, high price (top)). This will remain the favored case as long as 1.2154 support holds. Furthermore, if the trend is able to breakout through the first resistance level of 1.2212. So it will be good to buy at 1.2212 with the second target of 1.2260. It will also call for an uptrend in order to continue towards 1.2307. The daily strong resistance is seen at 1.2307. Thus, the market is indicating a bullish opportunity above the above-mentioned support levels, for that the bullish outlook remains the same as long as the 100 EMA is headed to the upside. The EUR/USD pair is still staying in strengthening from 1.2154 and intraday bias remains bullish. In case of another retreat, downside should be be contained by 1.2154 support to bring another rise. It would also be wise to consider where to place a stop loss; this should be set below the second support of 1.2117. Forecast : Uptrend scenario : An uptrend will start as soon, as the market rises above support level of level 1.2154, which will be followed by moving up to resistance level 1.2221. The movement is likely to resume to the point 1.2260 and further to the point 1.2307. Otherwise, the price spot of 1.2307 remains a significant resistance zone. Thus, the trend is still bearish as long as the level of 1.2307 is not breached. Technical analysis of GBP/USD for December 16, 2020 2020-12-16 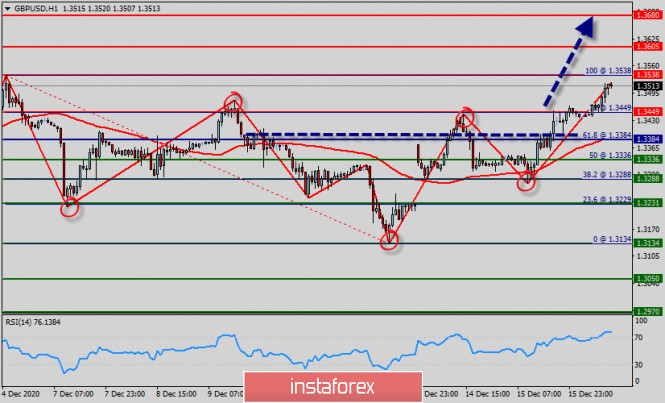 Overview : On one-hour chart, the GBP/USD pair is continuing in a bullish market from the supports of 1.3384 and 1.3449. Also, it should be noted that the current price is in a bullish channel. The 100-day moving average (red line) has been a key level in keeping the upside momentum going from a technical point of view while dollar weakness remains the key driver pushing the pair higher from a fundamental perspective. Equally important, the RSI is still signaling that the trend is upward as it is still strong above the moving average (100) since yesterday. Immediate support is seen at 1.3384 which coincides with a golden ratio (61.8% of Fibonacci). Consequently, the major support sets at the level of 1.3384. Minor support has already set at 1.3449. So, the market is likely to show signs of a bullish trend around the spot of 1.3449. Hence, major support is seen at the level of 1.3384 because the trend is still showing strength above it. Accordingly, the pair is still in the uptrend from the area of 1.3384 and 1.3449. The GBP/USD pair is trading in a bullish trend from the last support line of 1.3449 towards the first resistance level at 1.3538 in order to test it. This is confirmed by the RSI indicator signaling that we are still in the bullish trending market. Now, the pair is likely to begin an ascending movement to the point of 1.3449 and further to the level of 1.3538. The level of 1.3538 will act as first resistance and the double top is already set at the point of 1.3538. Also, it should be noted major resistance is seen at 1.3605, while immediate resistance is found at 1.3538. Then, we may anticipate potential testing of 1.3538 to take place soon. Moreover, if the pair succeeds in passing through the level of 1.3538, the market will indicate a bullish opportunity above the level of 1.3538. A breakout of that target will move the pair further upwards to 1.3605. Buy orders are recommended above the area of 1.3449 with the first target at the level of 1.3538; and continue towards 1.3605. Consequently, there is a possibility that the GBP/USD pair will move upside. The structure of a fall does not look corrective. At the same time, if a breakout happens at the support levels of 1.3384 and 1.3350, then this scenario may be invalidated. But in overall, we still prefer the bullish scenario. GBP/USD. Pound is still hoping for things to end happily 2020-12-16 The pound actively surged, despite the disappointing data on the growth of UK inflation. The market ignored the fact that today's published data was in the "red" zone. GBP/USD traders are completely absorbed in Brexit, as the negotiations have already entered their final stage. Moreover, a lot of optimistic forecasts regarding the prospects for concluding a deal are heard in the market today. The primary reason is Ursula von der Leyen's encouraging statements. Although the head of the European Commission clarified that the fishing issue is still unresolved, she stated that there is a progress in negotiations. This fact allowed the buyers of GBP/USD to test the 35th mark again, after the bears took control of the situation last Friday, who pushed down the price to the level of 1.31. It can be seen that the market is now very "trusting" – it quietly follows conflicting fundamental signals, although traders are sure that an optimistic scenario will be implemented. Therefore, market participants react more sharply to positive news, while pessimistic signals are treated with a certain degree of skepticism. For example, Reuters reported yesterday that during a close meeting, Boris Johnson recommended to the ministers to prepare for a "hard" scenario, that is, without a deal. However, this kind of threat (which was probably deliberately "leaked" to the press) did not make the proper impression on traders. The pound was under pressure for several hours, but it still surged, updating the weekly high at the end of Tuesday's trading day. 
According to the available information, the negotiating groups were able to agree on all key issues, except for fisheries. The question still remains whether Britain will decide to close off the problem of shared access to fishing waters. However, journalists from the influential Financial Times think that the British do not really intend to lose the single market, since the affected party will ultimately be Britain, not the European Union. The fact is that the UK directs more than 40% of its exports to the EU countries, while the key countries of the Alliance direct only 5-6% of their exports. At the same time, Europeans do not seriously consider the hypothetical advantage of the "Australian scenario", while the "Canadian scenario" was initially rejected. According to FT insiders, the deal will be initially concluded at the last moment and secondly, on the actual terms of the Europeans. According to informed sources of the publication, Brussels will agree to make certain concessions, thus securing its success in the negotiation process. And judging by the latest statements of top politicians, the above scenario is gradually being implemented. Now, let's talk a little about today's macroeconomic report. It is noteworthy that the dynamics of UK inflation was disappointing. The general consumer price index in November fell to -0.1% on monthly terms, while a downward trend was also recorded in annual terms. The indicator dropped to 0.3%, which is the weakest growth rate since August this year. Core inflation was also disappointing – the core CPI came out at 1.1%. The retail price index also showed a weak result both in annual and monthly terms. In light of such disappointing figures that were published before BoE's December meeting, there were rumors in the market about the introduction of a negative rate. In my opinion, these rumors are quite excessive, despite the fact that Central Bank's head, Andrew Bailey, has repeatedly admitted such a scenario. In view of this, the British press is doubtful that banks will charge customers for placing funds on deposits. The level of profitability of deposits in the national financial system is already minimal (the average deposit rate now does not exceed 0.1% per annum). Therefore, if the rate declines to the negative area, the banking sector will most likely refuse to pay interest on deposits, effectively equating the placement of money on accounts with storage in a safe deposit box. As for loans, the banks are likely to significantly tighten requirements for borrowers, fearing an increase in the share of "bad" debts, that is, it will become much more difficult to get approval for a loan application. These are just a few examples of the side effects of introducing a negative rate. Therefore, most experts doubt that this step will be the next decision of the English regulator. Analysts do not rule out such a scenario, but attribute it to extraordinary measures – for example, if Britain fails to conclude a trade deal with the European Union. 
The pound remains optimistic, while waiting for the result of the key round of Brexit. The European Commission's head announced that there will be a decision for everything in the next few days, that is, before the current week ends. If the parties manage to resolve the fishing issue, then the GBP/USD pair will surge at least to the upper line of the Bollinger Bands indicator on the monthly chart (1.3650), followed by its next target (1.37). It is recommended to open long positions on the pair, but the high risk of deep downward pullbacks prevents traders from doing this. Moreover, the market is too prone to "panic attacks", especially amid contradictory rumors. Therefore, it is better to take a wait-and-see position for now, despite the growing probability of a final happy ending. Trading idea for the EUR/USD pair 2020-12-16  EUR / USD continues to trade upward because of increased hopes for a post-Brexit trade deal and the general weakness of the US dollar. As a result, to date, the sellers' only hope is the level of 1.2180: 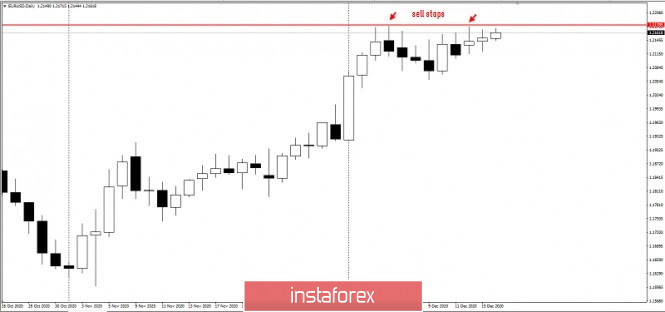 Based on the Stop Hunting strategy, this is the only level where sell stops may be placed. This is because traders, for several days already, have been consistently buying the euro in the market, thereby increasing the price higher and higher. 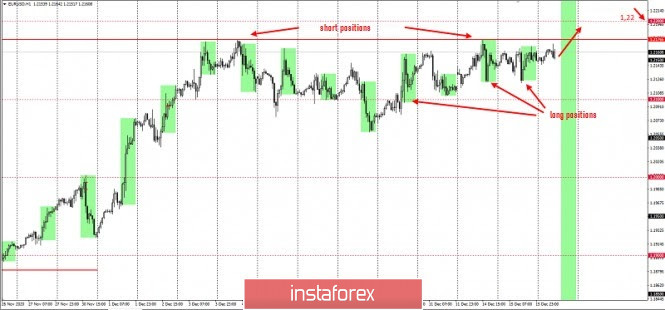 But since the quote is now at a very high level, it is best to refrain from opening long positions, and if possible, only work for an increase up to 1.21800 and 1.22000. This is in accordance with the Price Action and Stop Hunting strategies. Of course, traders still need to be careful since this financial market is very precarious. But, as mentioned before, it will give plenty of profit as long as you use the right approach. Good luck! EUR/USD analysis for December 16 2020 - Bull flag in creation on 30M time-frame and potential for test of 1.2250 2020-12-16 Eurozone October trade balance €25.9 billion vs €24.0 billion prior Latest data released by Eurostat - 16 December 2020 - Prior €24.0 billion; revised to €23.7 billion
Exports were higher by 2.1% m/m while imports were higher by 1.0% m/m, leading to the higher trade surplus in October. Trade conditions continue to improve but are still seen below pre-virus levels as we look towards the year-end. Further Development 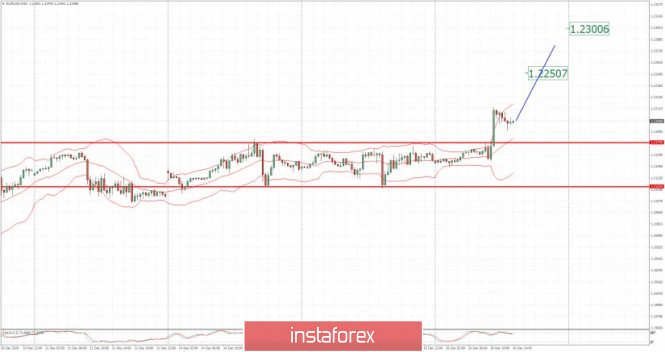
Analyzing the current trading chart of EUR/USD, I found that the buyers are in control and that we got mark up phase today. 1-Day relative strength performance Finviz Based on the graph above I found that on the top of the list we got VIX and Ethanol today and on the bottom CAD and Natural Gas. Key Levels: Resistance: 1,2250 and 1,2300. Support level: 1,2175 Analysis of Gold for December 16,.2020 - Watch for buying opportunities on the dips with upside target at $1.873 2020-12-16 US MBA mortgage applications w.e. 11 December +1.1% vs -1.2% prior Latest data from the Mortgage Bankers Association for the week ending 11 December 2020 Prior -1.2% - Market index 857.3 vs 848.3 prior
- Purchase index 331.6 vs 325.7 prior
- Refinancing index 4,014.5 vs 3,959.2 prior
- 30-year mortgage rate 2.85% vs 2.90% prior
The jump in mortgage activity in the past week comes from a rebound in purchases after the drop in the previous week, with refinancing activity also seen picking up amid the fall in the long-term mortgage rate to the lowest in the survey's history. 
Further Development 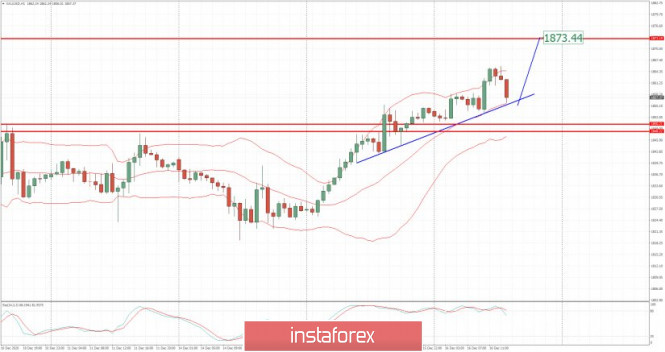
Analyzing the current trading chart of Gold, I found that the buyers are in control and that we got pullback into the rising trendline today. Based on the hourly time-frame I found the bullflag in creation, which is another sign for the upside continuation. 1-Day relative strength performance Finviz 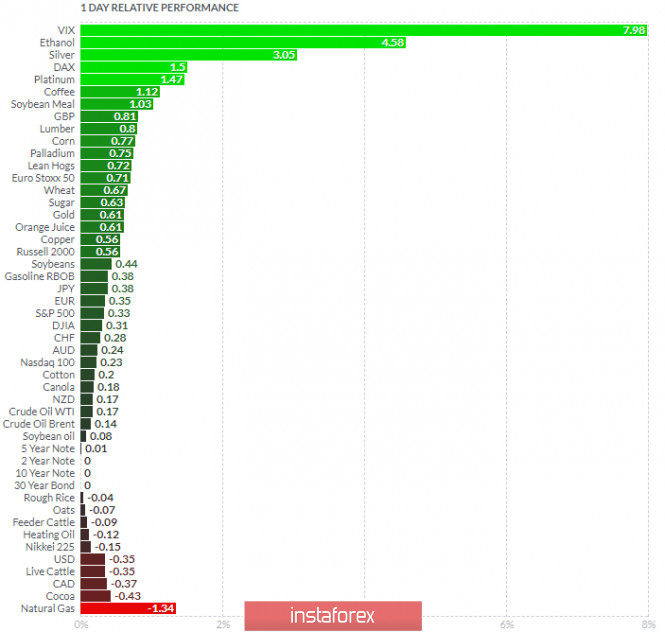
Based on the graph above I found that on the top of the list we got VIX and Ethanol today and on the bottom CAD and Natural Gas. Key Levels: Resistance: $1,873 Support level: $1,853 EUR/USD: plan for the American session on December 16 (analysis of morning deals) 2020-12-16 To open long positions on EURUSD, you need to: This week, we waited for signals to buy the euro and update the next annual high. Let's look at the 5-minute chart and figure out where you should have entered the market. In my morning forecast, I paid attention to purchases above the level of 1.2164, which happened. A breakout and test of this range from top to bottom formed a signal to open long positions, the target of which was a maximum of 1.2211, where the bulls actually pulled the pair. The sharp increase came after good data on the Eurozone services sector, as well as against the background of the demolition of a number of stop orders of speculative sellers, which were found above the level of 1.2164. 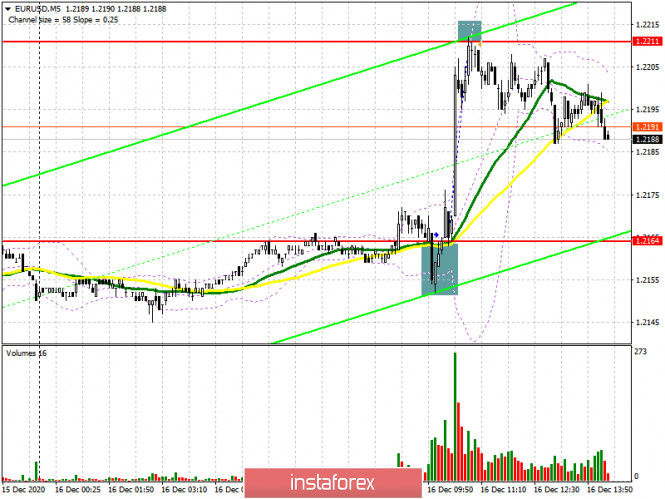
In the afternoon, the entire focus will shift to data on the United States service sector, as well as on manufacturing activity. However, the reports are unlikely to have much impact on the market, as the Federal Reserve's interest rate decision lies ahead. All that is required for euro buyers is not to let the resistance of 1.2211 go far. A repeated test of this level can lead to a breakdown and consolidation above. A test of this level from top to bottom will open a direct road to a new high of 1.2255, with the prospect of updating 1.2339, where I recommend fixing the profits. In the scenario of a return of pressure on EUR/USD before the publication of the Fed's monetary policy decision, it is best to postpone purchases until the support update of 1.2164. If there is no activity on the part of buyers, and good data on the US economy, it is possible to open long positions in EUR/USD only after testing the minimum of 1.2110 with the aim of a rebound of 20-25 points within the day. To open short positions on EURUSD, you need to: At the moment, sellers of the pound are focused on protecting the level of 1.2211, where the upward movement of the euro stopped today. Only the formation of a false breakout in the second half of the day will form a signal to open short positions, the main purpose of which will be to return EUR/USD to the level of 1.2164, for which buyers will actively fight. Fixing and testing this level from the bottom up on volume will lead to a larger sale of the euro to a minimum of 1.2110. It will be possible to talk about a breakdown of this range only after the publication of the Federal Reserve's decision on monetary policy. If it remains unchanged, it will give strength to the dollar and put pressure on the euro. In the scenario of a breakout and consolidation above 1.2211 in the second half of the day, which may be facilitated by weak data on activity in the US, it is best to postpone new short positions until the test of a larger resistance of 1.2255. I recommend selling EUR/USD immediately for a rebound from the maximum of 1.2339, based on a downward correction of 15-20 points within the day. 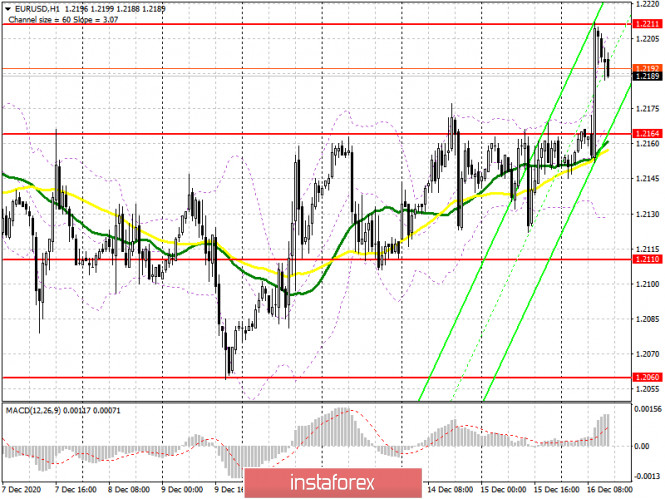
Let me remind you that the COT report (Commitment of Traders) for December 8 recorded an increase in long and a reduction in short positions. Buyers of risky assets believe in the continuation of the bull market, and in the further growth of the euro after breaking the psychological mark in the area of the 20th figure. Thus, long non-profit positions rose from the level of 207,302 to the level of 222,521, while short non-profit positions decreased to the level of 66,092 from the level of 67,407. Total non-commercial net position rose to the level of 156,139 against 894,429 a week earlier. It is worth paying attention to the growth of the delta, observed for the third week in a row, which completely negates the bearish trend observed in the early autumn of this year. Talk of a larger recovery will only be possible after European leaders agree with the UK on a new trade agreement. Signals of indicators: Moving averages Trading is conducted above 30 and 50 daily moving averages, which indicates an attempt by buyers to take control of the market. Note: The period and prices of moving averages are considered by the author on the hourly chart H1 and differ from the general definition of the classic daily moving averages on the daily chart D1. Bollinger Bands A break of the upper limit of the indicator in the area of 1.2211 will lead to a new wave of growth of the euro. If the pair declines, the lower limit of the indicator in the area of 1.2135 will provide support. Description of indicators - Moving average (moving average determines the current trend by smoothing out volatility and noise). Period 50. The graph is marked in yellow.
- Moving average (moving average determines the current trend by smoothing out volatility and noise). Period 30. The graph is marked in green.
- MACD indicator (Moving Average Convergence / Divergence - moving average convergence / divergence) Fast EMA period 12. Slow EMA period 26. SMA period 9
- Bollinger Bands (Bollinger Bands). Period 20
- Non-profit speculative traders, such as individual traders, hedge funds, and large institutions that use the futures market for speculative purposes and meet certain requirements.
- Long non-commercial positions represent the total long open position of non-commercial traders.
- Short non-commercial positions represent the total short open position of non-commercial traders.
- Total non-commercial net position is the difference between the short and long positions of non-commercial traders.
GBP/USD: plan for the American session on December 16 (analysis of morning deals) 2020-12-16 To open long positions on GBP/USD, you need to: In my morning forecast, I recommended opening long positions after a breakout and consolidation above the resistance of 1.3489, which happened. On the 5-minute chart, the bulls break above 1.3489, after which there is a great test of this level from the bottom up, which forms a good signal to buy the pound. Data on activity in the manufacturing sector and the UK service sector led to a larger increase in GBP/USD already in the resistance area of 1.3534, where I recommended taking profits and advised selling the pound on a rebound with a correction of 25-30 points. 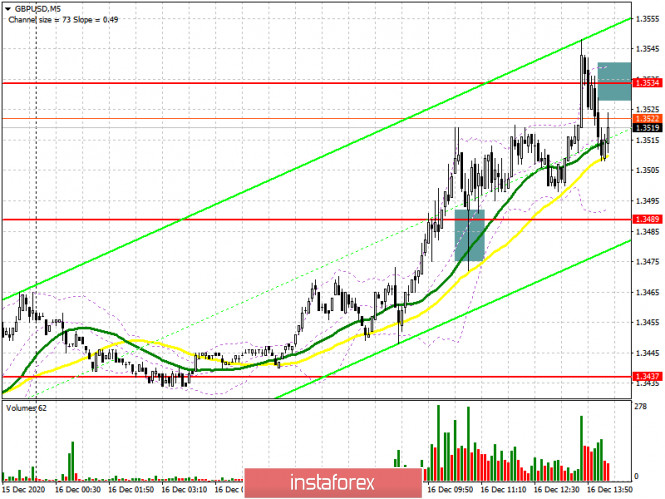
In the second half of the day, the main task of buyers will be to break and consolidate above the resistance of 1.3534. A test of this level from top to bottom, similar to the morning purchase, forms a good signal to open new long positions in the continuation of the strengthening of GBP/USD, which will allow the pair to go beyond the wide side channel in which it has been since the beginning of December this year. The nearest target of the bulls will be the resistance of 1.3604, the breakdown of which will quickly throw the pair to the area of 1.3648 and 1.3698, where I recommend taking the profits. If the pressure on the pound returns before the publication of the Federal Reserve's decision on interest rates or in the case of good data on activity in the United States, I recommend looking at purchases from the level of 1.3475, provided that a false breakdown is formed. You can buy GBP/USD immediately on the rebound from the minimum of 1.3406 in the expectation of a correction of 20-30 points within the day. There are also moving averages that play on the side of buyers of the pound. To open short positions on GBP/USD, you need to: Judging by what we are now seeing in the market, only bad news on the Brexit trade agreement will lead to a collapse of the GBP/USD. While the bull market is observed in all its glory and investors firmly believe that the negotiators will be able to find a compromise. At the moment, sellers of the pound need to form a false breakout in the resistance area of 1.3534. But if after this active downward movement in the pound does not occur, it is better not to go against the trend, but wait for the resistance update at 1.3604, from where you can sell the pound immediately on a rebound, counting on a correction of 20-30 points within the day. Larger resistance levels are seen in the area of 1.3648 and 1.3698. An equally important task for the bears in the second half of the day will be to regain control over the level of 1.3475, which will seriously affect the positions of buyers of the pound. Fixing and testing this level from the bottom up forms a good sell signal, the main goal of which will be the lows in the area of 1.3406 and 1.3345, where I recommend fixing the profits. 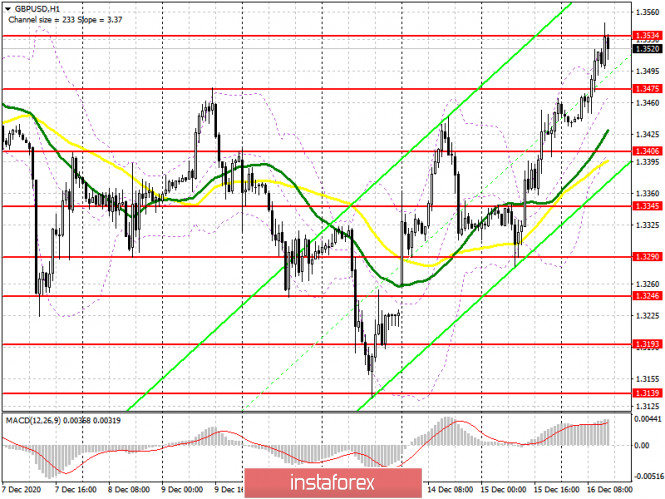
Let me remind you that in the COT reports (Commitment of Traders) for December 8, there is a significant interest in the British pound. Long non-commercial positions rose from 37,087 to 39,344. At the same time, short non-commercial positions decreased from 44,986 to 33,634. As a result, the non-commercial net position became positive and jumped to 5,710 against a negative value of -7,899 a week earlier. All this suggests that traders are ready to bet on further strengthening of the pound at the beginning of next year and the preponderance of buyers even in the current situation when there is no agreement on a trade agreement, and just over two weeks are left until the end of the year. Signals of indicators: Moving averages Trading is above 30 and 50 daily averages, which indicates that the pound will continue to recover in the short term. Note: The period and prices of moving averages are considered by the author on the hourly chart H1 and differ from the general definition of the classic daily moving averages on the daily chart D1. Bollinger Bands In the event of a decline in the pair, the average border of the indicator in the area of 1.3370 will act as support. Description of indicators - Moving average (moving average determines the current trend by smoothing out volatility and noise). Period 50. The graph is marked in yellow.
- Moving average (moving average determines the current trend by smoothing out volatility and noise). Period 30. The graph is marked in green.
- MACD indicator (Moving Average Convergence / Divergence - moving average convergence / divergence) Fast EMA period 12. Slow EMA period 26. SMA period 9
- Bollinger Bands (Bollinger Bands). Period 20
- Non-profit speculative traders, such as individual traders, hedge funds, and large institutions that use the futures market for speculative purposes and meet certain requirements.
- Long non-commercial positions represent the total long open position of non-commercial traders.
- Short non-commercial positions represent the total short open position of non-commercial traders.
- Total non-commercial net position is the difference between the short and long positions of non-commercial traders.
Author's today's articles: Sebastian Seliga  Sebastian Seliga was born on 13th Oсtober 1978 in Poland. He graduated in 2005 with MA in Social Psychology. He has worked for leading financial companies in Poland where he actively traded on NYSE, AMEX and NASDAQ exchanges. Sebastian started Forex trading in 2009 and mastered Elliott Wave Principle approach to the markets by developing and implementing his own trading strategies of Forex analysis. Since 2012, he has been writing analitical reviews based on EWP for blogs and for Forex websites and forums. He has developed several on-line projects devoted to Forex trading and investments. He is interested in slow cooking, stand-up comedy, guitar playing, reading and swimming. "Every battle is won before it is ever fought", Sun Tzu Sebastian Seliga was born on 13th Oсtober 1978 in Poland. He graduated in 2005 with MA in Social Psychology. He has worked for leading financial companies in Poland where he actively traded on NYSE, AMEX and NASDAQ exchanges. Sebastian started Forex trading in 2009 and mastered Elliott Wave Principle approach to the markets by developing and implementing his own trading strategies of Forex analysis. Since 2012, he has been writing analitical reviews based on EWP for blogs and for Forex websites and forums. He has developed several on-line projects devoted to Forex trading and investments. He is interested in slow cooking, stand-up comedy, guitar playing, reading and swimming. "Every battle is won before it is ever fought", Sun Tzu Vyacheslav Ognev  Vyacheslav was born on August 24, 1971. In 1993, he graduated from Urals State University of Economics in the Russian city of Ekaterinburg holding a degree in Commerce and Economics of Trade. In 2007, he started concentrating on the Russian stock market, trading stocks on the RTS Stock Exchange and futures contracts on FORTS. Since 2008 he has been engaged in analyzing Forex market and trading currencies. He is an author of a simplified wave analysis method. He has also developed a trading strategy. At present, Vyacheslav is a co-author of training materials on two web portals dedicated to Forex trading education. Interests: fitness, F1 "Experience is the best of schoolmasters, only the school fees are heavy." - Thomas Carlyle Vyacheslav was born on August 24, 1971. In 1993, he graduated from Urals State University of Economics in the Russian city of Ekaterinburg holding a degree in Commerce and Economics of Trade. In 2007, he started concentrating on the Russian stock market, trading stocks on the RTS Stock Exchange and futures contracts on FORTS. Since 2008 he has been engaged in analyzing Forex market and trading currencies. He is an author of a simplified wave analysis method. He has also developed a trading strategy. At present, Vyacheslav is a co-author of training materials on two web portals dedicated to Forex trading education. Interests: fitness, F1 "Experience is the best of schoolmasters, only the school fees are heavy." - Thomas Carlyle Alexander Dneprovskiy  Graduated from Kiev State University of Economics. On Forex market since 2007. Started his work at Forex as a trader. Since 2008 is working as a currency analyst. Graduated from Kiev State University of Economics. On Forex market since 2007. Started his work at Forex as a trader. Since 2008 is working as a currency analyst. Ivan Aleksandrov  Ivan Aleksandrov Ivan Aleksandrov Mihail Makarov  - - l Kolesnikova  text text Mourad El Keddani  Was born in Oujda, Morocco. Currently lives in Belgium. In 2003 obtained B.S. in Experimental Sciences. In 2007 obtained a graduate diploma at Institut Marocain Specialise en Informatique Applique (IMSIA), specialty – Software Engineering Analyst. In 2007–2009 worked as teacher of computer services and trainer in a professional school specializing in computer technologies and accounting. In 2005 started Forex trading. Authored articles and analytical reviews on Forex market on Forex websites and forums. Since 2008 performs Forex market research, and develops and implements his own trading strategies of Forex analysis (especially in Forex Research & Analysis, Currency Forecast, and Recommendations and Analysis) that lies in: Numerical analysis: Probabilities, equations and techniques of applying Fibonacci levels. Classical analysis: Breakout strategy and trend indicators. Uses obtained skills to manage traders' accounts since 2009. In April 2009 was certified Financial Technician by the International Federation of Technical Analysts. Winner of several social work awards: Education Literacy and Non-Formal Education (in Literacy and Adult Education in The National Initiative for Human Development). Was born in Oujda, Morocco. Currently lives in Belgium. In 2003 obtained B.S. in Experimental Sciences. In 2007 obtained a graduate diploma at Institut Marocain Specialise en Informatique Applique (IMSIA), specialty – Software Engineering Analyst. In 2007–2009 worked as teacher of computer services and trainer in a professional school specializing in computer technologies and accounting. In 2005 started Forex trading. Authored articles and analytical reviews on Forex market on Forex websites and forums. Since 2008 performs Forex market research, and develops and implements his own trading strategies of Forex analysis (especially in Forex Research & Analysis, Currency Forecast, and Recommendations and Analysis) that lies in: Numerical analysis: Probabilities, equations and techniques of applying Fibonacci levels. Classical analysis: Breakout strategy and trend indicators. Uses obtained skills to manage traders' accounts since 2009. In April 2009 was certified Financial Technician by the International Federation of Technical Analysts. Winner of several social work awards: Education Literacy and Non-Formal Education (in Literacy and Adult Education in The National Initiative for Human Development).
Languages: Arabic, English, French and Dutch.
Interests: Algorithm, Graphics, Social work, Psychology and Philosophy. Irina Manzenko  Irina Manzenko Irina Manzenko Andrey Shevchenko  Andrey Shevchenko Andrey Shevchenko Petar Jacimovic  Petar was born on July 08, 1989 in Serbia. Graduated from Economy University and after has worked as a currency analyst for large private investors. Petar has been involved in the world of finance since 2007. In this trading he specializes in Volume Price Action (volume background, multi Fibonacci zones, trend channels, supply and demand). He also writes the market analytical reviews for Forex forums and websites. Moreover Petar is forex teacher and has wide experience in tutoring and conducting webinars. Interests : finance, travelling, sports, music "The key to success is hard work" Petar was born on July 08, 1989 in Serbia. Graduated from Economy University and after has worked as a currency analyst for large private investors. Petar has been involved in the world of finance since 2007. In this trading he specializes in Volume Price Action (volume background, multi Fibonacci zones, trend channels, supply and demand). He also writes the market analytical reviews for Forex forums and websites. Moreover Petar is forex teacher and has wide experience in tutoring and conducting webinars. Interests : finance, travelling, sports, music "The key to success is hard work" Maxim Magdalinin  In 2005 graduated from the Academy of the Ministry of Internal Affairs of the Republic of Belarus, law faculty. Worked as a lawyer for three years in one of the biggest country's company. Besides the trading, he develops trading systems, writes articles and analytical reviews. Works at stock and commodity markets explorations. On Forex since 2006. In 2005 graduated from the Academy of the Ministry of Internal Affairs of the Republic of Belarus, law faculty. Worked as a lawyer for three years in one of the biggest country's company. Besides the trading, he develops trading systems, writes articles and analytical reviews. Works at stock and commodity markets explorations. On Forex since 2006.
Subscription's options management Theme's:
Fundamental analysis, Fractal analysis, Wave analysis, Technical analysis, Stock Markets
Author's :
A Zotova, Aleksey Almazov, Alexander Dneprovskiy, Alexandr Davidov, Alexandros Yfantis, Andrey Shevchenko, Arief Makmur, Dean Leo, Evgeny Klimov, Fedor Pavlov, Grigory Sokolov, I Belozerov, Igor Kovalyov, Irina Manzenko, Ivan Aleksandrov, l Kolesnikova, Maxim Magdalinin, Mihail Makarov, Mohamed Samy, Mourad El Keddani, Oleg Khmelevskiy, Oscar Ton, Pavel Vlasov, Petar Jacimovic, R Agafonov, S Doronina, Sebastian Seliga, Sergey Belyaev, Sergey Mityukov, Stanislav Polyanskiy, T Strelkova, Torben Melsted, V Isakov, Viktor Vasilevsky, Vladislav Tukhmenev, Vyacheslav Ognev, Yuriy Zaycev, Zhizhko Nadezhda
Edit data of subscription settings
Unsubscribe from the mailing list Sincerely,
Analysts Service | If you have any questions, you can make a phone call using one of the
InstaForex Toll free numbers right now:
|  | InstaForex Group is an international brand providing online trading services to the clients all over the world. InstaForex Group members include regulated companies in Europe, Russia and British Virgin Islands. This letter may contain personal information for access to your InstaForex trading account, so for the purpose of safety it is recommended to delete this data from the history. If you have received this letter by mistake, please contact InstaForex Customer Relations Department. |


No comments:
Post a Comment