| Large gold mining companies saw a 5% decrease in output in 2020 2020-12-28 ![]()

Statistics say that in 2020, the top 20 gold mining companies saw a 5% decrease in output, primarily due to work interruptions associated with the imposed quarantine. Fortunately, production will most likely recover in 2021, and based on mid-term projections, it would reach 6% more than the revised post-quarantine projections for 2020. This year, the global gold mining industry has faced unprecedented problems caused by production interruptions, which were the main factors behind the notable production drops recorded in several regions. North America, South America and Africa have experienced the greatest impact. Canada produced 1,160 koz of gold in the second quarter of 2020, which is significantly less (-22%) than the 1,482 koz it mined in the second quarter of 2019. Quebec's production, meanwhile, was down a record 32% in Q2 2020 compared to Q2 2019, while gold production in Ontario fell by 17%. The main factor behind these sharp drops was both government-sanctioned and voluntary production interruptions. Initially, the top 20 gold miners were planning to mine about 39,118 koz of gold in 2020, before the emergence of COVID-19. After the suspensions were lifted, many affected companies revised their production forecasts for 2020, and as a result, the figure dropped to 337,291 koz of gold. On the bright side, in the third quarter of 2020, many gold miners saw a record growth in output, as they sought to make up for production lost during the suspensions. Therefore, for 2021, the top 20 gold miners plan to mine 39,381 koz of gold, calculated as the sum of the averages of their respective production forecasts, which is 6% more than the revised post-quarantine forecast for 2020. Technical recommendations for EUR/USD and GBP/USD on 12/28/20 2020-12-28 EUR/USD 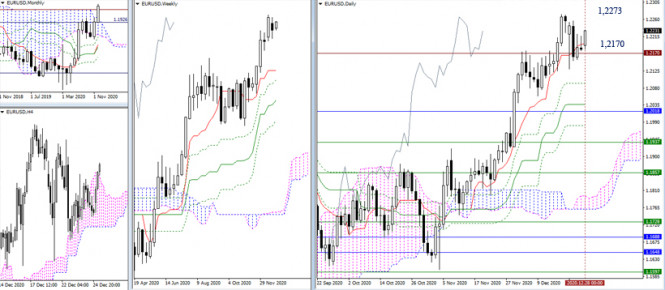 The initiative belongs to the bulls after the holidays and weekends. Currently, the pair remains in the movement zone of the previous week. An achievement and an opportunity to turn the favor on the bulls' side is to consolidate above the high (1.2273). If December closes with bullish optimism, new prospects can be considered. On the contrary, if the bulls do not dominate now, and the bears manage to confirm the prerequisites for a weekly reversal candlestick pattern, then the bearish scenario in the near future will be very relevant. 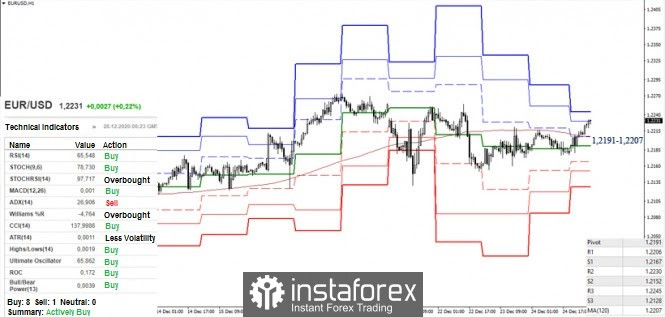 The analyzed technical instruments are now giving the bulls the initial advantage in the smaller time frame. The upward pivot points are the resistance levels of 1.2230 and 1.2245. In turn, the loss of key supports 1.2191 (central pivot level) and 1.2207 (weekly long-term trend) will change the favor towards the opponent on the hourly TF. So, further support for classic pivot levels today can be noted at 1.2167 - 1.2152 - 1.2128. GBP/USD 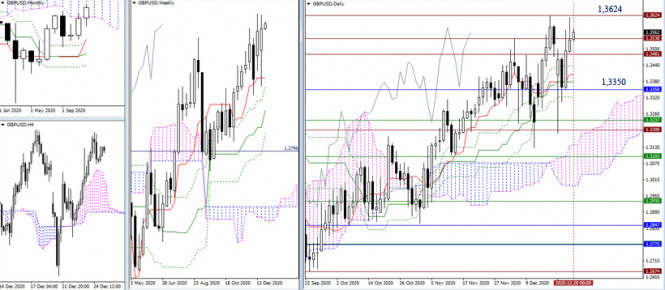 This week began without any sharp change in the situation. The bulls are now hoping to recover the lost and unsecured positions last Friday. As a result, the overall distribution of forces as well as further development options and prospects remains the same. The attraction which is now provided by historical levels of 1.3538 - 1.3481 - 1.3624 (high extreme) and 1.3350 (lower limit of the monthly cloud) can affect the change of moods and opportunities. 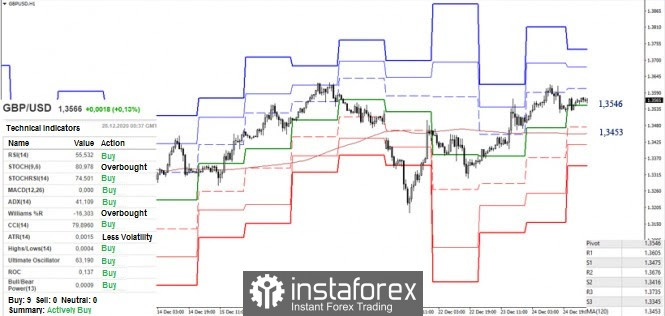 Today, the key supports in the smaller time frame are located at 1.3546 (central pivot level) and 1.3453 (weekly long-term trend). A movement above these levels keeps the initial advantage on the bulls' side, but losing support levels will give the advantage to the side of the opponent. If the pair remains in the attraction zone of the levels and does not show effective movements, then there will most likely be a time of uncertainty and reflection before the close of the month and year. Ichimoku Kinko Hyo (9.26.52), Pivot Points (classical), Moving Average (120) Trading plan for the EUR/USD pair on December 28. Significant decline in COVID-19 incidence. 2020-12-28 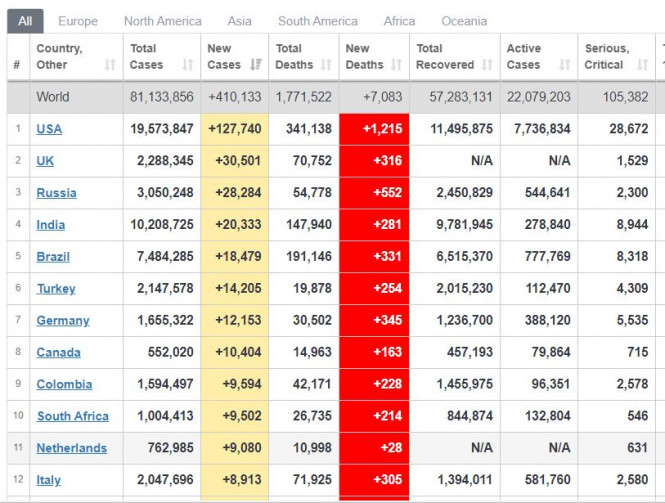
A significant decrease has been observed in terms of global COVID-19 incidence, recording only 410,000 over the weekend. In the United States, new cases totaled to only 127,000, while the UK listed only 30,000. However, these figures may only be because of the holidays Anyhow, vaccinations are underway, progressing at a strong pace both in the US and Britain. Vaccinations in the EU, meanwhile, starts today. Another good news is that a Brexit trade deal has been concluded, and Trump signed the US budget for 2021. 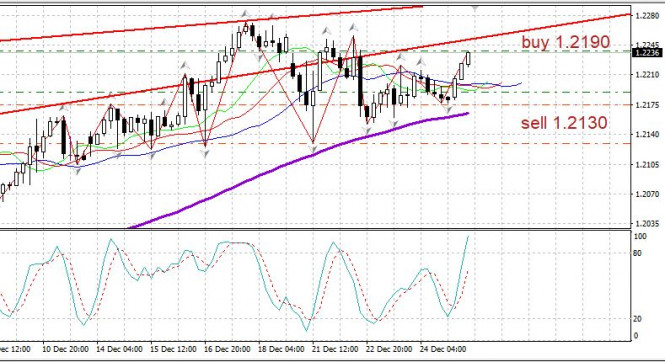
EUR/USD - bulls are attempting to raise the euro in the market. Open long positions from 1.2190. Set up subsequent positions after a breakout and pullback from 1.2280. Stop and reversal is at 1.2130, but can be moved to 1.2150 and even 1.2175. GBP/USD rushed up amid trade deal consensus 2020-12-28 While European and British officials are full of euphoria over the biggest trade deal in the UK's history, the euphoria in financial markets is slowly fading. The GBP/USD pair rushed up after reports that London and Brussels came to a consensus, but failed to gain a foothold above 1.36. Since the end of September, when the Brexit negotiations entered the final stage, the pound has grown against the US dollar by 7%, which suggests that the positive has already been taken into account in the quotes. Is it time to sell on the facts? First of all, you need to understand the details of the agreement. Both sides will continue to trade without tariffs, Britain will be able to conclude contracts with other countries on its own behalf, but will be forced to follow EU standards. If, for example, Brussels changes them, and London does not do the same, the European Union will have the opportunity to impose sanctions. The free flow of workers between countries will cease, and trade in services will significantly decrease. Its share in the UK accounts for about 80% of GDP, so the forecast of the Office for Budget Responsibility, that even with a successful Brexit, the economy will not reach 4% within 15 years, looks logical. If an agreement could not be reached, the loss would amount to 6%. UK GDP dynamics: 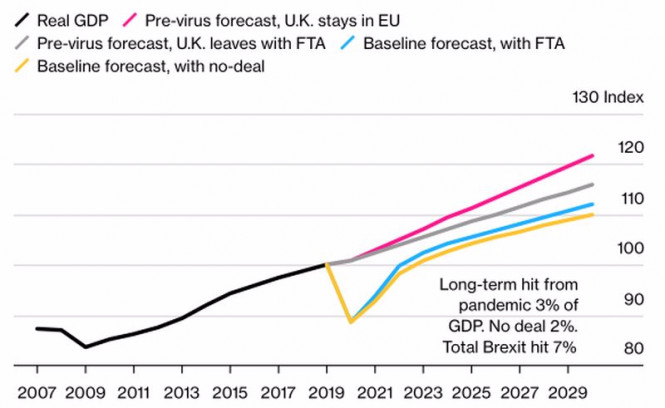
A successful Brexit allows the British economy to avoid the worst-case scenario for itself. A break in relations with the region, which accounts for 43% of exports and 52% of imports, would be a real disaster and, according to Bloomberg experts, would bring down the GBP/USD quotes to 1.25. According to Boris Johnson, the agreement will put an end to uncertainty in British politics and will help in the recovery of the UK economy after the pandemic. A deal is primarily about confidence. In my opinion, it is the reduction of uncertainty that will contribute to the continuation of the rally of sterling against the US dollar. The fall in the volatility of the pound and the undervaluation of British assets are important drivers of the growth of the analyzed pair. Since the 2016 referendum, the FTSE-100 has been losing out to the world's major stock indexes in both local currency and dollar terms. At the same time, 2021 promises to be a great time for stocks in case of the victory over the pandemic and the rapid growth of global GDP. It is not surprising that the number of recommendations for buying undervalued securities of British issuers is growing. Pound volatility dynamics: 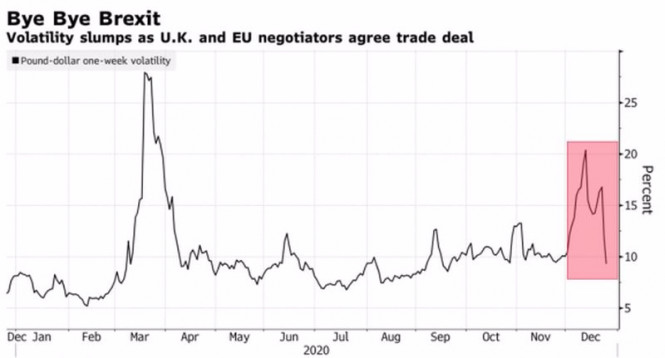
While the GBP/USD pair digests the information, weighs the consequences of the deal, and does not rush to rise, it will certainly follow global trends. In particular, the idea of further growth in global risk appetite and the sale of safe-haven assets. In this regard, Societe Generale's forecast that the pound will reach $1.4 very soon does not look like a utopia. Technically, if we proceed from the target of 161.8% on the AB=CD pattern, the potential of the upward movement of GBP/USD is far from exhausted. Rebounds from supports at 1.345 and 1.34, as well as a breakout of resistance at 1.362 should be used to build up longs formed from the level of 1.333. GBP/USD daily chart: 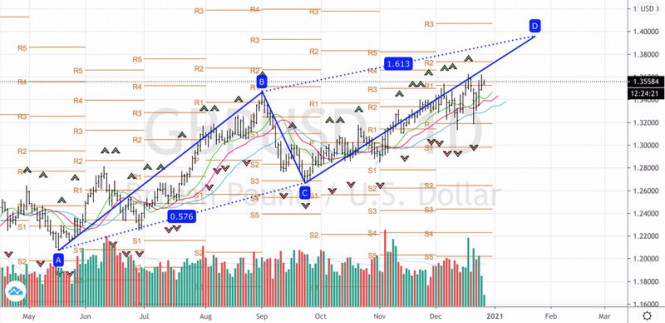
Technical analysis of EUR/USD for December 28, 2020 2020-12-28 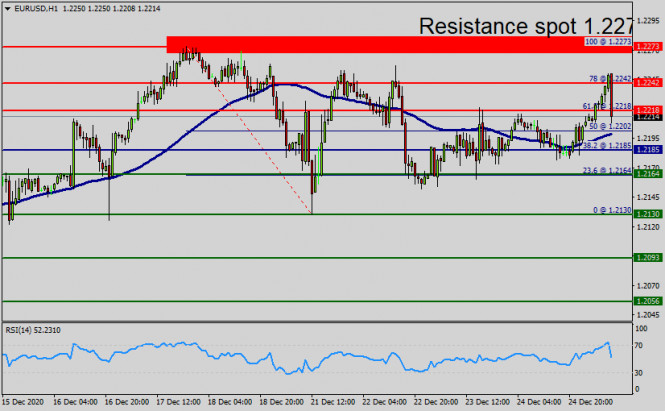 Overview : The EUR/USD pair has faced strong support at the level of 1.2273 because resistance became support. So, the strong resistance has been already faced at the level of 1.2273 and the pair is likely to try to approach it in order to test it again. The level of 1.2185 represents a weekly pivot point for that it is acting as minor support this week. However, if the EUR/USD pair fails to break through the resistance level of 1.2273 this week, the market will decline further to 1.2273. The pair is expected to drop lower towards at least 1.2185 with a view to test the weekly pivot point. Also, it should be noted that the weekly pivot point will act as minor support today. Furthermore, the EUR/USD pair is continuing to trade in a bullish trend from the new support level of 1.2185 . Currently, the price is in a bullish channel. According to the previous events, we expect the EUR/USD pair to move between 1.2185 and 1.2273. Also, it should be noticed that the double top is set at 1.2273. Additionally, the RSI is still signaling that the trend is upward as it remains strong above the moving average (100). This suggests the pair will probably go up in coming hours. Accordingly, the market is likely to show signs of a bullish trend. Thus, the market is indicating a bullish opportunity above the above-mentioned support levels, for that the bullish outlook remains the same as long as the 100 EMA is headed to the upside. In other words, buy orders are recommended above 1.2185 with the first target at the level of 1.2240. If the trend is be able to break the double top at the level of 1.2240, then the market will continue rising towards the weekly resistance 2 at 1.2273. On the other hand, the price area of 1.2273 remains a significant resistance zone. Thus, the trend is still bearish as long as the level of 1.2273 is not breached. Technical analysis of GBP/USD for December 28, 2020 2020-12-28 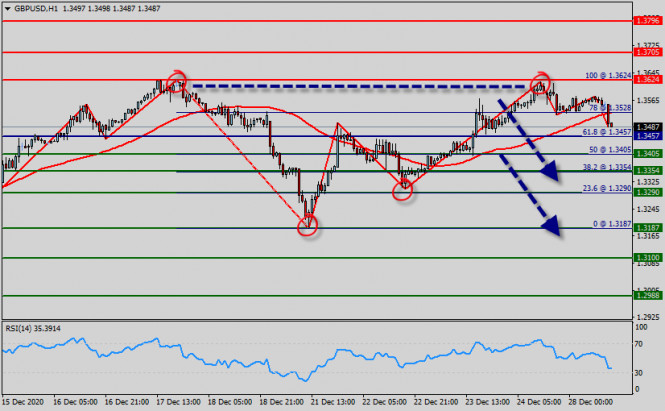 Overview : The GBP/USD pair fell from the level of 1.3624 to bottom at 1.3191. Today, theGBP/USD pair has faced strong support at the level of 1.3457. So, the strong support has already faced at the level of 1.3457 and the pair is likely to try to approach it in order to test it again and form this support on the H1 chart. Hence, the GBP/USD pair is continuing to trade in a bearish trend from the new support level of 1.3457; to form a bearish channel. According to the previous events, we expect the pair to move between 1.3528 and 1.3187. Also, it should be noted major resistance is seen at 1.3624, while immediate resistance is found at 1.3528. Then, we may anticipate potential testing of 1.3528 to take place soon. Moreover, if the pair fails in passing through the level of 1.3528, the market will indicate a bearish opportunity below the level of 1.3528. A breakout of that target will move the pair further downwards to 1.3457. Sell orders are recommended belo the area of 1.3528 with the first target at the level of 1.3457; and continue towards the objectives of 1.3354, 1.3290 and then the market will decline further to the level of1.3787 ( last bearish wave, low price). Since the trend is below the region of 1.3624 - 1.3528, the market is still in a downtrend. Overall, we still prefer the bearish scenario. On the other hand, stop loss should always be taken into account, accordingly, it will be of beneficial to set the stop loss below the last bullish wave at the level of 1.3624. Analysis and Forecast on EUR/USD for December 28, 2020 2020-12-28 Today's review of the main currency pair of the Forex market will begin with an important message from the United States of America. So far, the current US President, Donald Trump, has signed a draft budget for next year, which includes a package of stimulus measures to counter COVID-19. The said package amounts to $900 billion. I would also like to draw attention to the fact that earlier Trump refused to sign this proposal, referring to the fact that one-time benefits for citizens whose annual income is below $75,000 should not be $600, but $2,000. As a result of the signed bill, it was possible to avoid a partial closure of state institutions due to the lack of their funding, that is, a shutdown. The current President took this step in exchange for a promise that the US Congress will pay serious attention to the violations that, according to Trump, took place in the last presidential election. In Europe, preparations are in full swing for the start of mass vaccination against the coronavirus pandemic. However, about 1,000 doses of Pfizer vaccines in Germany were stored at temperatures below -70 degrees. Thus, vaccination is recommended to start in several German states since it is not certain that the vaccine, stored at an unacceptable temperature, has retained all its properties. Nevertheless, according to European Commission President Ursula von der Leyen, the vaccination plan for EU citizens has been drawn up and everything is ready for work. Europe will prioritize vaccination among the elderly who are in medical institutions, as well as staff who provide care for them. However, with regard to the vaccination of EU citizens, not everything is so clear and simple. According to surveys, only 41% are ready to get vaccinated, and 59% at this stage are afraid to do so. In my opinion, this is a consequence of various information in the media about this or that vaccine. I think it is no secret that the purchase of a particular vaccine requires huge funds, so there is a persistent struggle for sales markets, and the media play a very important role here. Daily 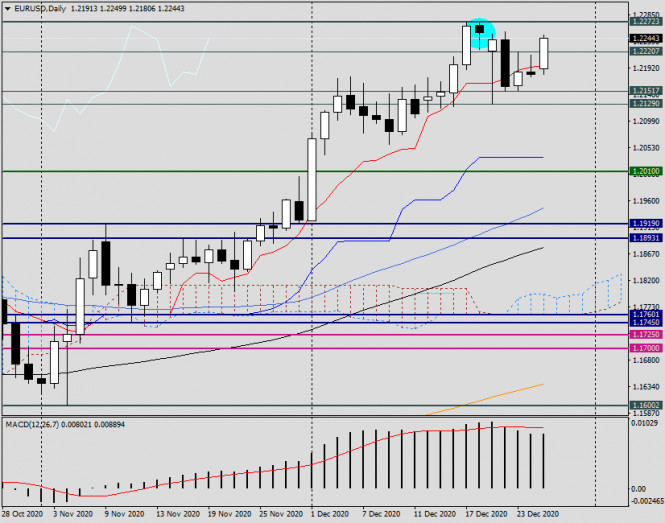
Based on the technical picture of the main currency pair, the EUR/USD began the week with growth. The news of Trump's signing of the budget for 2021, which includes a new package of measures to support the national economy, inspired optimism, and supported the craving for risky operations among bidders. At the moment, the EUR/USD pair is trading above the red Tenkan line of the Ichimoku indicator, as well as above the maximum trading values of December 23-24. If the euro bulls manage to maintain and increase the current upward potential, the pair will probably re-believe the strength of the strong resistance of sellers at 1.2272, the true breakout of which will open the way to higher goals, namely, the price zone of 1.2300-1.2320. H1 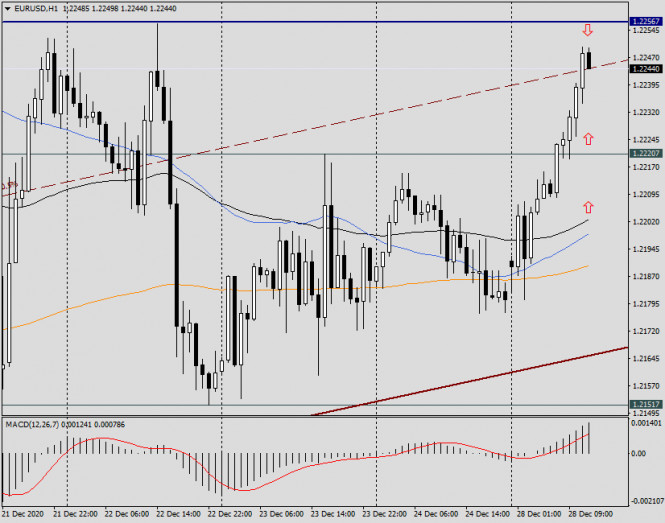
According to trading recommendations, I suggest looking for purchases of EUR/USD after short-term declines in the price area of 1.2225 and, possibly, lower, in the area of accumulation of hourly moving averages: 89 EMA, 50 MA, and 200 EMA, which are in the range of 1.2205-1.2190. There are also recommendations for sales. The nearest opening of short positions will be possible only when bearish candlestick analysis patterns appear in the resistance zone of 1.2256-1.2272 on the four-hour and/or hourly charts of this currency pair. Note that sales are the most risky positioning, as they are against the current upward trend, which is again gaining momentum. Successful bidding! EUR/USD: plan for the American session on December 28 (analysis of morning deals) 2020-12-28 To open long positions on EURUSD, you need to: In my morning forecast, I paid attention to purchases after the breakdown and consolidation above the level of 1.2218. Let's take a look at the 5-minute chart and analyze what happened. It can be seen how the bulls are firmly fixed above 1.2218 and against the background of the lack of important fundamental statistics, they are gradually pushing the euro up to the resistance of 1.2254. The top-down test of the level of 1.2218 was a signal to open long positions. However, before the update of the level of 1.2254, we were 4 points short. In general, the upward movement in the first half of the day turned out to be quite good. 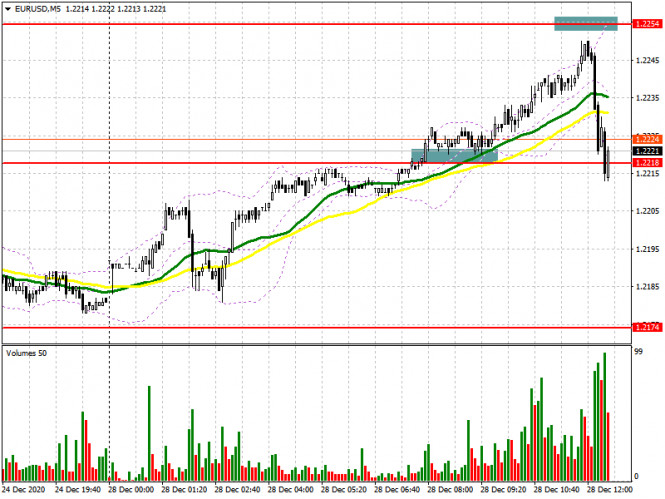
The sharp movement of the pair down to the area of 1.2218 and its breakdown indicates that there is no major player in the market who would be able to protect this range inside the day. In this regard, the relevance of the forecast for the first half of the day is already moving to the second. Larger players will continue to focus on protecting the support of 1.2174. Only the formation of a false breakout there in the second half will lead to the formation of a signal to open long positions in the euro. However, given the lack of important fundamental statistics and low trading volume in the last week before the New Year, you can not count on serious activity in the area of 1.2174. In the absence of any action in the return of EUR/USD to the support of 1.2174, I recommend postponing long positions until the update of last week's low in the area of 1.2130. You can also buy the euro immediately on the rebound from the new local minimum in the area of 1.2083, based on a correction of 20-25 points within the day. It will be possible to say that the buyers of the euro managed to return the market under their control only after the breakout and consolidation above the resistance of 1.2218. However, only a test of this level from top to bottom, by analogy with this morning's purchase, forms an additional signal to open long positions in the euro with the main goal of returning to the resistance of 1.2254, where I recommend fixing the profits. To open short positions on EURUSD, you need to: Sellers are now trying to regain control of the level of 1.2218, which they missed today in the first half of the day. A return to this area and consolidation below, with the test of 1.2218 already from the bottom up, forms a signal to open short positions. The main target of the bears will be to update the minimum of 1.2174, where I recommend fixing the profits. It should be understood that only fixing below this range and testing it from the reverse side will increase the pressure on the pair, which will form a new entry point into short positions. The main target of the bears will be the area around 1.2130. We can hardly expect a breakout of this range at the beginning of this week. However, if this happens, a larger downward movement to the area of 1.2083 is not excluded, and the key target of the bears at the end of the year will be the area of 1.2042, where I recommend fixing the profits. It is worth noting that in the second half of the day there are data on the German consumer price index, which is unlikely to seriously affect the market, however, given the lack of other fundamental data, it is necessary to pay attention to it. If there is no activity of bears at the level of 1.2218, I recommend to postpone short positions until the test of the maximum of 1.2254 or sell EUR/USD immediately on the rebound from the resistance of 1.2304 in the expectation of a correction of 20-25 points within the day. 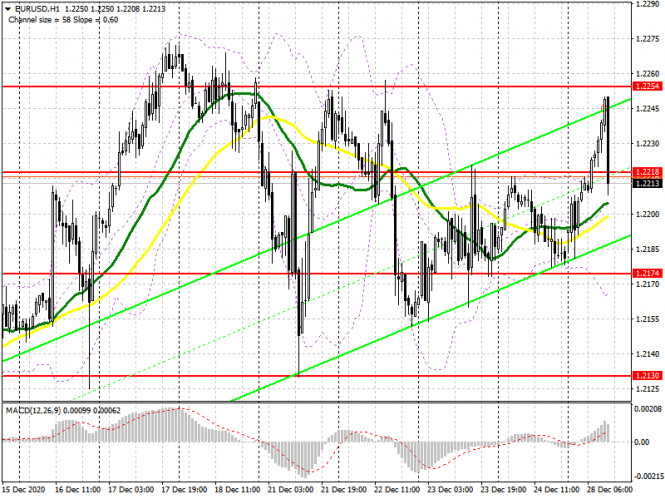
Let me remind you that the COT report (Commitment of Traders) for December 15 recorded an increase in short positions and a reduction in long ones. Although buyers of risky assets believe in the continuation of the bull market, especially against the background of the start of vaccination in the Eurozone, which started this weekend, however, the rush to buy at current highs has decreased. Thus, long non-profit positions decreased from the level of 222,521 to the level of 218,710, while short non-profit positions increased from the level of 66,092 to the level of 76,877. The total non-profit net position fell to 141,833 from 156,429 a week earlier. The growth of the delta, which was observed for three consecutive weeks, has stopped, so it is unlikely that you can expect rapid growth of the euro at the end of this year. It will be possible to talk about further major recovery only after the new year, when the first reports on the economic state of the EU will begin in December 2020. Signals of indicators: Moving averages Trading is above 30 and 50 daily moving averages, which indicates a slight advantage for euro buyers Note: The period and prices of moving averages are considered by the author on the hourly chart H1 and differ from the general definition of the classic daily moving averages on the daily chart D1. Bollinger Bands If the pair declines, the lower limit of the indicator around 1.2174 will provide support. Description of indicators - Moving average (moving average determines the current trend by smoothing out volatility and noise). Period 50. The graph is marked in yellow.
- Moving average (moving average determines the current trend by smoothing out volatility and noise). Period 30. The graph is marked in green.
- MACD indicator (Moving Average Convergence / Divergence - moving average convergence / divergence) Fast EMA period 12. Slow EMA period 26. SMA period 9
- Bollinger Bands (Bollinger Bands). Period 20
- Non-profit speculative traders, such as individual traders, hedge funds, and large institutions that use the futures market for speculative purposes and meet certain requirements.
- Long non-commercial positions represent the total long open position of non-commercial traders.
- Short non-commercial positions represent the total short open position of non-commercial traders.
- Total non-commercial net position is the difference between the short and long positions of non-commercial traders.
GBP/USD: plan for the American session on December 28 (analysis of morning deals). 2020-12-28 To open long positions on GBPUSD, you need to: In the first half of the day, the British pound fell sharply against the US dollar, as optimists become much less. In my morning forecast, I recommended opening short positions from the level of 1.3539. Let's take a look at the 5-minute chart, and talk about where you could enter the market. It is visible how the pound breaks through the area of 1.3539, after which several stop orders are demolished and the pair falls. However, to my regret, I missed this deal, as I did not wait for a convenient entry point. On the chart, I noted where I would open short positions in the continuation of the downward trend. However, the test of the level of 1.3539 from the bottom up did not happen. 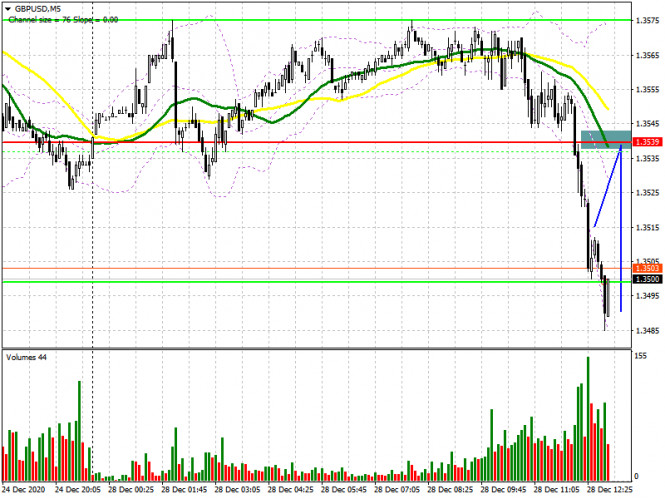
At the moment, as long as trading is below the level of 1.3539, the pressure on the pound will remain. Therefore, it is time for buyers to think about how to protect the support of 1.3474, to which the pair is slowly but surely declining. The formation of a false breakout will be a signal to open long positions to return to the resistance of 1.3539, where I recommend fixing the profits. If there is no activity of buyers at this level and its breakdown, it is best to postpone purchases to a larger support area of 1.3404, from which you can open long positions immediately for a rebound in the expectation of a correction of 30-35 points within the day. An equally important task for the bulls will be to regain control over the resistance of 1.3539, as only in this case it will be possible to count on the continuation of the upward trend in the pound at the end of this year. The test of the area of 1.3539 forms a good buy signal with an exit to a maximum of 1.3623. To open short positions on GBPUSD, you need to: Bears coped with the task for the first half of the day and did not let the pair to the highs of this year, taking control of the support of 1.3539. While trading will be conducted below this range, we can expect the pound to fall to the support area of 1.3474, which is now the primary target of sellers. Only fixing below this range with a test of it from the bottom up will open a direct road to the area of the minimum of 1.3404, where I recommend fixing the profits. If the pressure on the pound eases in the second half of the day, an upward correction of GBPUSD is not excluded. In this case, I recommend opening short positions only after the resistance test of 1.3539, provided that a false breakout is formed or immediately on a rebound from the annual maximum of 1.3623 with the aim of a downward correction of 30-35 points within the day. 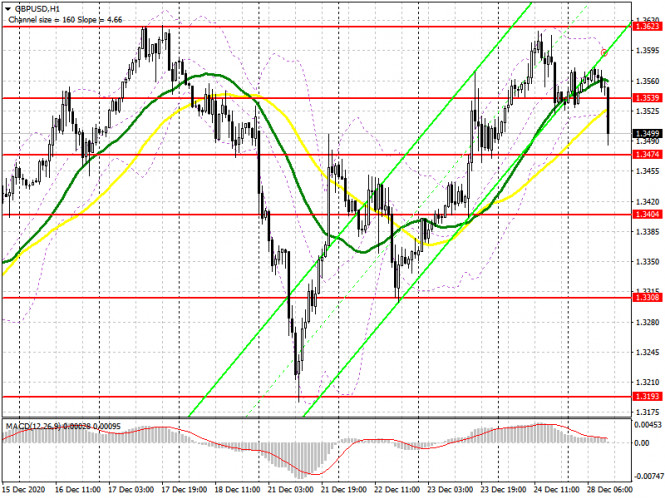
Let me remind you that in the COT reports (Commitment of Traders) for December 15, there is a decrease in interest in the British pound, both buyers and sellers. Long non-profit positions fell from 39,344 to 35,128, while short non-profit positions fell from 33,634 to 31,060. As a result, the non-profit net position remained positive, but fell to the level of 4,068, against 5,710 a week earlier. Given that the UK has imposed strict quarantine measures due to a new strain of coronavirus that is out of control, and for which there is no vaccine yet, it will not be the right decision to expect a further strengthening of the pound at the end of this year. The good news on Brexit will no longer be able to push the pair up. Signals of indicators: Moving averages Trading is conducted below 30 and 50 daily averages, which indicates the probability of forming a downward correction for the pound. Note: The period and prices of moving averages are considered by the author on the hourly chart H1 and differ from the general definition of the classic daily moving averages on the daily chart D1. Bollinger Bands If the pair grows, the upper limit of the indicator will act as a resistance in the area of 1.3590, from where you can sell the pound immediately for a rebound. Description of indicators - Moving average (moving average determines the current trend by smoothing out volatility and noise). Period 50. The graph is marked in yellow.
- Moving average (moving average determines the current trend by smoothing out volatility and noise). Period 30. The graph is marked in green.
- MACD indicator (Moving Average Convergence / Divergence - moving average convergence / divergence) Fast EMA period 12. Slow EMA period 26. SMA period 9
- Bollinger Bands (Bollinger Bands). Period 20
- Non-profit speculative traders, such as individual traders, hedge funds, and large institutions that use the futures market for speculative purposes and meet certain requirements.
- Long non-commercial positions represent the total long open position of non-commercial traders.
- Short non-commercial positions represent the total short open position of non-commercial traders.
- Total non-commercial net position is the difference between the short and long positions of non-commercial traders.
Analysis of Gold for December 28,.2020 - Testing of the rising trendline and potential for upside continuation towards $1.896 2020-12-28 EU ambassadors approve provisional application of Brexit trade deal Green light for : EU Ambassadors have unanimously approved the provisional application of the EU-UK Trade and Cooperation Agreement as of January 1, 2021. Based on the graph above I found that on the top of the list we got Silver and Ethanol today and on the bottom Natural Gas and VIX. Gold is slightly negative today... Key Levels: Resistance: $1,896 and $1,907 Support level: $1,868 EUR/USD analysis for December 28 2020 - Targets reached and potential for the upside continuation towards 1.2250 2020-12-28 UK's Gove: If AstraZeneca vaccine rollout goes well, we'll be in a place to lift restrictions quickly Gove building up further optimism going into the new year The UK is widely expected to approve the AstraZeneca/Oxford vaccine in the coming days, with the rollout then set to begin in the first week of January. The announcement is expected some time this week, as early as tomorrow so watch out for that. While I wouldn't doubt the optimism as more vaccines are rolled out, I would take Gove's remarks with a pinch of salt. Up until Christmas eve, there has been just over 600,000 people that have been vaccinated in the UK. While the AstraZeneca/Oxford vaccine may be easier to store/transport and is cheaper, it doesn't take away the fact that it is still going to take a long while before we see the impact of the vaccines on the health crisis in general. Further Development 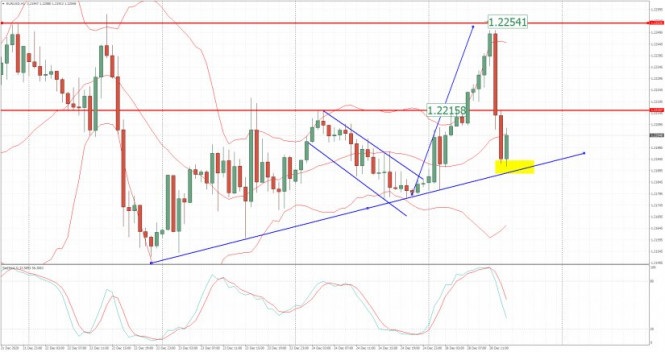
Analyzing the current trading chart of GBP/USD, I found that EUR reached our Friday's target at 1,2250 but then rejected strongly. Anyway, the rising trend line is still active and I would watch for buying opportunities on the dips with potential for re-test of tithe 1,2215 and 1,2250. 1-Day relative strength performance Finviz 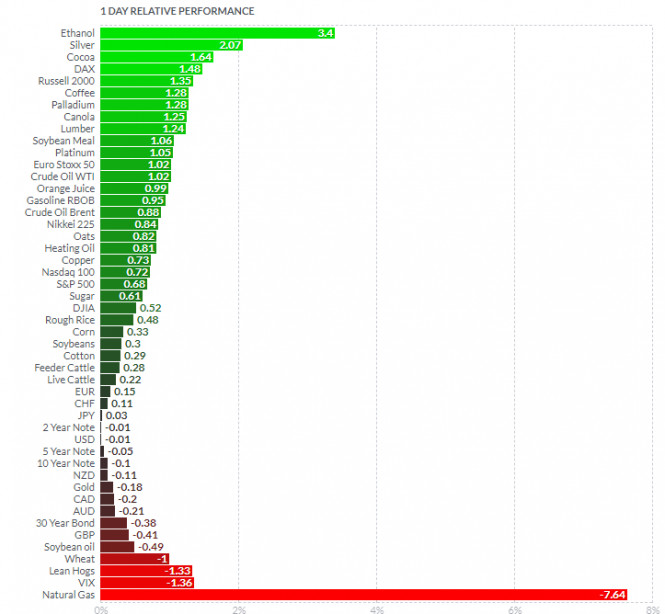
Based on the graph above I found that on the top of the list we got Silver and Ethanol today and on the bottom Natural Gas and VIX. Key Levels: Resistance: 1,2215 and 1,2250 Support level: 1,2180
Author's today's articles: Andrey Shevchenko  Andrey Shevchenko Andrey Shevchenko Zhizhko Nadezhda  Graduated from Irkutsk State University. Having acquainted with Forex market in 2008, followed the courses in the International Academy of Stock Exchange Trading. The agenda was so exiting that she moved to St. Petersburg in order to get professional education. Obtained a diploma of the retraining course on the discipline Exchange market and stock market issues, defended the graduation paper with distinction on the subject "Modern technical indicators as the basis of the trading system". At the moment obtains a master degree in International Banking Institute on specialty Financial markets and investments. Apart from trading is occupied with development of trading systems and formalization of the working strategies using Ichimoku indicator. At the moment is working on the book dedicated to the peculiarities of Ichimoku indicator and its operating methods. Interests: yoga, literature, travelling and photograph. "You can only get smarter by playing a smarter opponent" Basics of Chess play, 1883 "Successful people change by themselves, the others are changed by life" Jim Rohn Graduated from Irkutsk State University. Having acquainted with Forex market in 2008, followed the courses in the International Academy of Stock Exchange Trading. The agenda was so exiting that she moved to St. Petersburg in order to get professional education. Obtained a diploma of the retraining course on the discipline Exchange market and stock market issues, defended the graduation paper with distinction on the subject "Modern technical indicators as the basis of the trading system". At the moment obtains a master degree in International Banking Institute on specialty Financial markets and investments. Apart from trading is occupied with development of trading systems and formalization of the working strategies using Ichimoku indicator. At the moment is working on the book dedicated to the peculiarities of Ichimoku indicator and its operating methods. Interests: yoga, literature, travelling and photograph. "You can only get smarter by playing a smarter opponent" Basics of Chess play, 1883 "Successful people change by themselves, the others are changed by life" Jim Rohn Mihail Makarov  - - Igor Kovalyov  Igor Kovalyov was born on September 24, 1985. Igor graduated from Krasnoyarsk State University with a degree in Philology and Journalism. He has a wide experience as a newspaper and information agency correspondent. He got interested in financial markets in 2001. He also graduated from Moscow State University of Economics, Statistics, and Informatics (MESI) with a degree in Global Economics and then served as an analyst in an investment company. He has been working at InstaForex since 2014. Igor Kovalyov was born on September 24, 1985. Igor graduated from Krasnoyarsk State University with a degree in Philology and Journalism. He has a wide experience as a newspaper and information agency correspondent. He got interested in financial markets in 2001. He also graduated from Moscow State University of Economics, Statistics, and Informatics (MESI) with a degree in Global Economics and then served as an analyst in an investment company. He has been working at InstaForex since 2014. Mourad El Keddani  Was born in Oujda, Morocco. Currently lives in Belgium. In 2003 obtained B.S. in Experimental Sciences. In 2007 obtained a graduate diploma at Institut Marocain Specialise en Informatique Applique (IMSIA), specialty – Software Engineering Analyst. In 2007–2009 worked as teacher of computer services and trainer in a professional school specializing in computer technologies and accounting. In 2005 started Forex trading. Authored articles and analytical reviews on Forex market on Forex websites and forums. Since 2008 performs Forex market research, and develops and implements his own trading strategies of Forex analysis (especially in Forex Research & Analysis, Currency Forecast, and Recommendations and Analysis) that lies in: Numerical analysis: Probabilities, equations and techniques of applying Fibonacci levels. Classical analysis: Breakout strategy and trend indicators. Uses obtained skills to manage traders' accounts since 2009. In April 2009 was certified Financial Technician by the International Federation of Technical Analysts. Winner of several social work awards: Education Literacy and Non-Formal Education (in Literacy and Adult Education in The National Initiative for Human Development). Was born in Oujda, Morocco. Currently lives in Belgium. In 2003 obtained B.S. in Experimental Sciences. In 2007 obtained a graduate diploma at Institut Marocain Specialise en Informatique Applique (IMSIA), specialty – Software Engineering Analyst. In 2007–2009 worked as teacher of computer services and trainer in a professional school specializing in computer technologies and accounting. In 2005 started Forex trading. Authored articles and analytical reviews on Forex market on Forex websites and forums. Since 2008 performs Forex market research, and develops and implements his own trading strategies of Forex analysis (especially in Forex Research & Analysis, Currency Forecast, and Recommendations and Analysis) that lies in: Numerical analysis: Probabilities, equations and techniques of applying Fibonacci levels. Classical analysis: Breakout strategy and trend indicators. Uses obtained skills to manage traders' accounts since 2009. In April 2009 was certified Financial Technician by the International Federation of Technical Analysts. Winner of several social work awards: Education Literacy and Non-Formal Education (in Literacy and Adult Education in The National Initiative for Human Development).
Languages: Arabic, English, French and Dutch.
Interests: Algorithm, Graphics, Social work, Psychology and Philosophy. Ivan Aleksandrov  Ivan Aleksandrov Ivan Aleksandrov Maxim Magdalinin  In 2005 graduated from the Academy of the Ministry of Internal Affairs of the Republic of Belarus, law faculty. Worked as a lawyer for three years in one of the biggest country's company. Besides the trading, he develops trading systems, writes articles and analytical reviews. Works at stock and commodity markets explorations. On Forex since 2006. In 2005 graduated from the Academy of the Ministry of Internal Affairs of the Republic of Belarus, law faculty. Worked as a lawyer for three years in one of the biggest country's company. Besides the trading, he develops trading systems, writes articles and analytical reviews. Works at stock and commodity markets explorations. On Forex since 2006. Petar Jacimovic  Petar was born on July 08, 1989 in Serbia. Graduated from Economy University and after has worked as a currency analyst for large private investors. Petar has been involved in the world of finance since 2007. In this trading he specializes in Volume Price Action (volume background, multi Fibonacci zones, trend channels, supply and demand). He also writes the market analytical reviews for Forex forums and websites. Moreover Petar is forex teacher and has wide experience in tutoring and conducting webinars. Interests : finance, travelling, sports, music "The key to success is hard work" Petar was born on July 08, 1989 in Serbia. Graduated from Economy University and after has worked as a currency analyst for large private investors. Petar has been involved in the world of finance since 2007. In this trading he specializes in Volume Price Action (volume background, multi Fibonacci zones, trend channels, supply and demand). He also writes the market analytical reviews for Forex forums and websites. Moreover Petar is forex teacher and has wide experience in tutoring and conducting webinars. Interests : finance, travelling, sports, music "The key to success is hard work"
Subscription's options management Theme's:
Fundamental analysis, Fractal analysis, Wave analysis, Technical analysis, Stock Markets
Author's :
A Zotova, Aleksey Almazov, Alexander Dneprovskiy, Alexandr Davidov, Alexandros Yfantis, Andrey Shevchenko, Arief Makmur, Dean Leo, Evgeny Klimov, Fedor Pavlov, Grigory Sokolov, I Belozerov, Igor Kovalyov, Irina Manzenko, Ivan Aleksandrov, l Kolesnikova, Maxim Magdalinin, Mihail Makarov, Mohamed Samy, Mourad El Keddani, Oleg Khmelevskiy, Oscar Ton, Pavel Vlasov, Petar Jacimovic, R Agafonov, S Doronina, Sebastian Seliga, Sergey Belyaev, Sergey Mityukov, Stanislav Polyanskiy, T Strelkova, Torben Melsted, V Isakov, Viktor Vasilevsky, Vladislav Tukhmenev, Vyacheslav Ognev, Yuriy Zaycev, Zhizhko Nadezhda
Edit data of subscription settings
Unsubscribe from the mailing list Sincerely,
Analysts Service | If you have any questions, you can make a phone call using one of the
InstaForex Toll free numbers right now:
|  |  InstaForex Group is an international brand providing online trading services to the clients all over the world. InstaForex Group members include regulated companies in Europe, Russia and British Virgin Islands. This letter may contain personal information for access to your InstaForex trading account, so for the purpose of safety it is recommended to delete this data from the history. If you have received this letter by mistake, please contact InstaForex Customer Relations Department. |


 Andrey Shevchenko
  Graduated from Irkutsk State University. Having acquainted with Forex market in 2008, followed the courses in the International Academy of Stock Exchange Trading. The agenda was so exiting that she moved to St. Petersburg in order to get professional education. Obtained a diploma of the retraining course on the discipline Exchange market and stock market issues, defended the graduation paper with distinction on the subject "Modern technical indicators as the basis of the trading system". At the moment obtains a master degree in International Banking Institute on specialty Financial markets and investments. Apart from trading is occupied with development of trading systems and formalization of the working strategies using Ichimoku indicator. At the moment is working on the book dedicated to the peculiarities of Ichimoku indicator and its operating methods. Interests: yoga, literature, travelling and photograph. "You can only get smarter by playing a smarter opponent" Basics of Chess play, 1883 "Successful people change by themselves, the others are changed by life" Jim Rohn
  -
-  Igor Kovalyov was born on September 24, 1985. Igor graduated from Krasnoyarsk State University with a degree in Philology and Journalism. He has a wide experience as a newspaper and information agency correspondent. He got interested in financial markets in 2001. He also graduated from Moscow State University of Economics, Statistics, and Informatics (MESI) with a degree in Global Economics and then served as an analyst in an investment company. He has been working at InstaForex since 2014.
  Was born in Oujda, Morocco. Currently lives in Belgium. In 2003 obtained B.S. in Experimental Sciences. In 2007 obtained a graduate diploma at Institut Marocain Specialise en Informatique Applique (IMSIA), specialty – Software Engineering Analyst. In 2007–2009 worked as teacher of computer services and trainer in a professional school specializing in computer technologies and accounting. In 2005 started Forex trading. Authored articles and analytical reviews on Forex market on Forex websites and forums. Since 2008 performs Forex market research, and develops and implements his own trading strategies of Forex analysis (especially in Forex Research & Analysis, Currency Forecast, and Recommendations and Analysis) that lies in: Numerical analysis: Probabilities, equations and techniques of applying Fibonacci levels. Classical analysis: Breakout strategy and trend indicators. Uses obtained skills to manage traders' accounts since 2009. In April 2009 was certified Financial Technician by the International Federation of Technical Analysts. Winner of several social work awards: Education Literacy and Non-Formal Education (in Literacy and Adult Education in The National Initiative for Human Development).
 Ivan Aleksandrov
  In 2005 graduated from the Academy of the Ministry of Internal Affairs of the Republic of Belarus, law faculty. Worked as a lawyer for three years in one of the biggest country's company. Besides the trading, he develops trading systems, writes articles and analytical reviews. Works at stock and commodity markets explorations. On Forex since 2006.
  Petar was born on July 08, 1989 in Serbia. Graduated from Economy University and after has worked as a currency analyst for large private investors. Petar has been involved in the world of finance since 2007. In this trading he specializes in Volume Price Action (volume background, multi Fibonacci zones, trend channels, supply and demand). He also writes the market analytical reviews for Forex forums and websites. Moreover Petar is forex teacher and has wide experience in tutoring and conducting webinars. Interests : finance, travelling, sports, music "The key to success is hard work"
No comments:
Post a Comment