| EUR/USD: plan for the European session on December 28. COT reports. Euro remains in the channel, buyers set to surpass resistance of 1.2218 2020-12-28 To open long positions on EUR/USD, you need: The pre-Christmas trades were rather calm and within the horizontal channel. Given the low volatility of the market, no entry signals were generated. The news that a trade agreement between the UK and the EU was reached at the last moment did not greatly agitate the markets that were getting ready for Christmas. The technical picture has not changed. Buyers will continue to focus on protecting support at 1.2174. Forming a false breakout there in the first half of the day, similar to the previous buy deals, which I analyzed in my daily reviews, will lead to forming a signal to open long positions in the euro. However, given the lack of important fundamental statistics and the low trading volume in the final week before the New Year, most likely buyers will not be active. In case traders are not active when EUR/USD returns to support at 1.2174, I recommend postponing long positions until last week's low (1.2130) has been updated. It is also possible to buy the euro immediately on a rebound from a new local low at 1.2083, counting on a correction of 20-25 points within the day. It will only be possible to say that buyers of the euro have managed to regain control of the market when the pair has surpassed and settled above the resistance of 1.2218. However, testing this level from top to bottom creates an additional signal to buy the euro with the main goal of returning resistance at 1.2254, where I recommend taking profits. 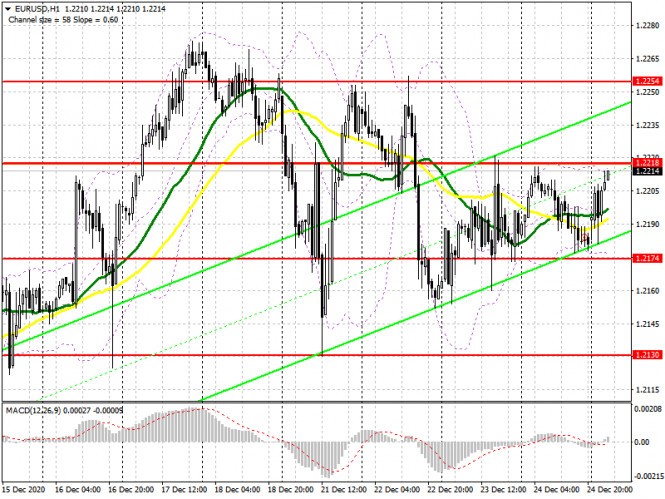
To open short positions on EUR/USD, you need: Sellers of the euro aim to regain control over the 1.2174 level. Getting the pair to settle below this range and testing it from the other side will increase the pressure on the pair, which creates a good entry point for short positions. In this case, the main target will be this week's low at 1.2130. The pair is unlikely to surpass this area early this week. However, if it does happen, falling towards 1.2083 is not excluded, and the key target at the end of the year will be the 1.2042 area, where I recommend taking profits. An equally important task is to protect resistance at 1.2218, near which trade is now being conducted. Forming a false breakout there creates a good entry point for short positions in hopes to return to the support area of 1.2174. Data on the German consumer price index will be released today, which is unlikely to seriously affect the market, but given the lack of other fundamental data, we can pay attention to it. If bears are not active at the 1.2218 level, I recommend postponing short positions until the high of 1.2254 has been tested, or sell EUR/USD immediately on a rebound from the resistance of 1.2304, counting on a correction of 20-25 points within the day. Let me remind you that the Commitment of Traders (COT) report for December 15 recorded an increase in short positions and a reduction in long ones. Although buyers of risky assets believe that the bull market will continue, especially amid the beginning of vaccinations in the eurozone, which started this weekend, however, the rush to buy at current highs has obviously diminished. Long non-commercial positions fell from 222,521 to 218,710, while short non-commercial positions increased from 66,092 to 76,877. The total non-commercial net position fell from 156,429 to 141,833 a week earlier. The growth of the delta, which was observed for three consecutive weeks, has stopped, so it will hardly be possible to count on the euro's rapid growth at the end of this year. It will be possible to talk about a major recovery only after the new year, when the first reports on the EU's economic state in December 2020 will start to be released. Indicator signals: Moving averages Trading is carried out in the area of 30 and 50 moving averages, which indicates market uncertainty. Note: The period and prices of moving averages are considered by the author on the H1 hourly chart and differs from the general definition of the classic daily moving averages on the daily D1 chart. Bollinger Bands A breakout of the lower border of the indicator in the 1.2174 area will increase pressure on the euro. The breakout of the upper border in the 1.2218 area will lead to a new wave of euro growth. Description of indicators - Moving average (moving average, determines the current trend by smoothing out volatility and noise). Period 50. It is marked in yellow on the chart.
- Moving average (moving average, determines the current trend by smoothing out volatility and noise). Period 30. It is marked in green on the chart.
- MACD indicator (Moving Average Convergence/Divergence — convergence/divergence of moving averages) Quick EMA period 12. Slow EMA period to 26. SMA period 9
- Bollinger Bands (Bollinger Bands). Period 20
- Non-commercial speculative traders, such as individual traders, hedge funds, and large institutions that use the futures market for speculative purposes and meet certain requirements.
- Long non-commercial positions represent the total long open position of non-commercial traders.
- Short non-commercial positions represent the total short open position of non-commercial traders.
- Total non-commercial net position is the difference between short and long positions of non-commercial traders.
GBP/USD: plan for the European session on December 28. COT reports. EU-UK trade deal has been concluded. Bulls need to surpass 1.3623 2020-12-28 To open long positions on GBP/USD, you need: The last-minute trade deal between the EU and the UK did not have much of an impact on the pound as everyone expected. Two signals to enter the market appeared on Thursday. Let's take a look at the 5-minute chart and break it down. A breakout and being able to settle above the 1.3566 level, followed by its test from top to bottom, created a good signal to open long positions as the pound continues to rise. This was especially true at a time when everyone was waiting for an agreement to be reached. The growth took place in the resistance area of 1.3623, where I recommended taking profit. It was possible to make short positions from this level immediately on a rebound, but in fairness, it is worth saying that I missed this trade, since there was no desire to sell against the background of a trade transaction, and a false breakout was created to enter against the upward trend, I also did not wait for it. 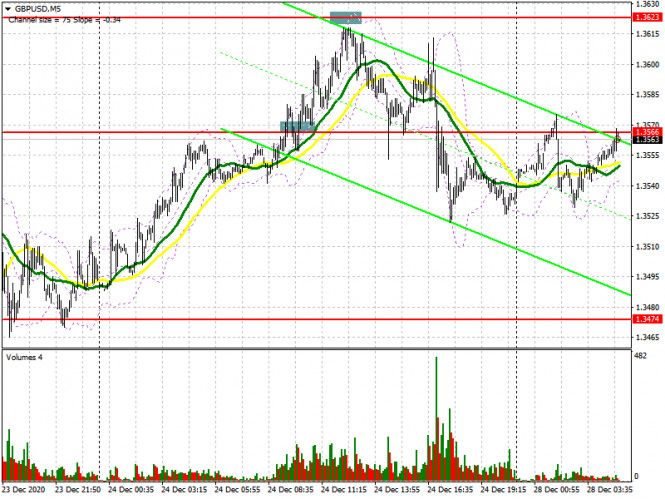
Buyers are currently focused on resistance at 1.3623. A breakout and being able to settle at this level while testing it from top to bottom creates a good entry point into sustaining the bull market. In this case, we can expect the pair to rise to a high of 1.3690 and its update, with an exit to the 1.3750 area, where I recommend taking profits. If the pound is under pressure this morning, it is best to open long positions after forming a false breakout in the support area of 1.3540, where the moving averages are, playing on the side of the pound buyers. I recommend buying GBP/USD immediately on a rebound from a low of 1.3474, or even lower, from a larger support area of 1.3404, counting on an upward correction of 35-40 points within the day. To open short positions on GBP/USD, you need: Given that there is no more optimism associated with the trade, a downward correction in the British pound is quite likely. However, it's best not to rush to sell GBP/USD today. Forming a false breakout in the resistance area of 1.3623 will return pressure to the pair and lead to a downward correction to the support area of 1.3540, on which the pair's succeeding direction depends, which is now in a horizontal channel. Surpassing this level and testing it from the bottom up creates a good signal to open short positions in order to sustain the downward correction while anticipating the pair to fall to lows of 1.3474 and 1.3404, where I recommend taking profits. In case the pound grows further at the beginning of this week, I recommend not rushing to sell. It is best to wait for the renewal of new annual highs around 1.3690 and 1.3750, where you can open short positions for a rebound, counting on a decline of 20-30 points within the day. 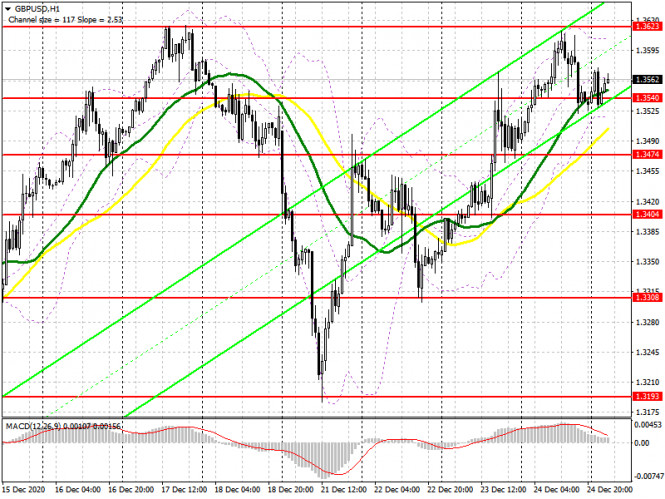
There was a decrease in interest in the British pound for both buyers and sellers in the Commitment of Traders (COT) report for December 15. Long non-commercial positions fell from 39,344 to 35,128. At the same time, short non-commercial positions decreased from 33,634 to 31,060. As a result, the non-commercial net position, although it remained positive, dropped to 4,068 against 5,710 a week earlier. Given that the UK has imposed tough quarantine measures due to a new strain of coronavirus that has gotten out of control and for which there is no vaccine yet, counting on the pound to strengthen further at the end of this year will not be the right decision. Good Brexit news will no longer be able to push the pair higher. Indicator signals: Moving averages Trading is carried out in the area of 30 and 50 moving averages, which indicates the sideways nature of the market in the short term. Note: The period and prices of moving averages are considered by the author on the H1 hourly chart and differs from the general definition of the classic daily moving averages on the daily D1 chart. Bollinger Bands A breakout of the upper border of the indicator around 1.3620 will lead to a new wave of growth in the pound. A breakout of the lower boundary at 1.3510 will increase pressure on the pair. Description of indicators - Moving average (moving average, determines the current trend by smoothing out volatility and noise). Period 50. It is marked in yellow on the chart.
- Moving average (moving average, determines the current trend by smoothing out volatility and noise). Period 30. It is marked in green on the chart.
- MACD indicator (Moving Average Convergence/Divergence — convergence/divergence of moving averages) Quick EMA period 12. Slow EMA period to 26. SMA period 9
- Bollinger Bands (Bollinger Bands). Period 20
- Non-commercial speculative traders, such as individual traders, hedge funds, and large institutions that use the futures market for speculative purposes and meet certain requirements.
- Long non-commercial positions represent the total long open position of non-commercial traders.
- Short non-commercial positions represent the total short open position of non-commercial traders.
- Total non-commercial net position is the difference between short and long positions of non-commercial traders.
Indicator analysis. Daily review on the EUR/USD currency pair for December 28, 2020 2020-12-28 Trend analysis (Fig. 1). Today, the market from the level of 1.2181 (closing of Friday's daily candle), while moving upward, can test the historical resistance level of 1.2234 (blue dotted line) and then continue to move upward with the upper target of 1.2275 - a pullback level of 85.4% (yellow dotted line). 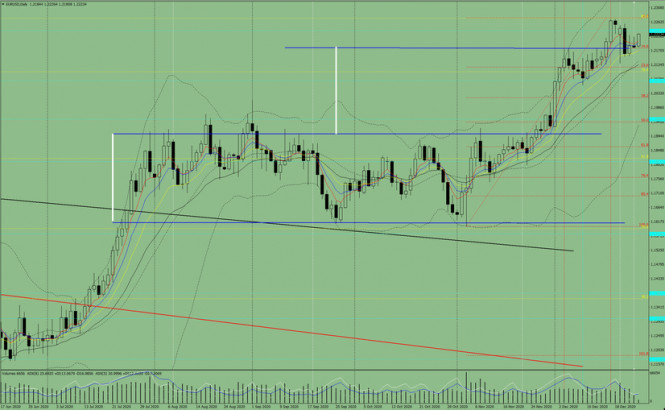
Figure 1 (Daily Chart). Comprehensive analysis: - Indicator analysis - up;
- Fibonacci levels - up;
- Volumes - up;
- Candlestick analysis - up;
- Trend analysis - up;
- Bollinger bands - up;
- Weekly chart - up.
General conclusion: Today, the price from the level of 1.2181 (closing of Friday's daily candle), while moving upward, can test the historical level of 1.2234 (blue dotted line) and then continue to move upward with the upper target of 1.2275 - a pullback level of 85.4% (yellow dotted line). Unlikely scenario: from the level of 1.2181 (closing of Friday's daily candle), while moving upward, it can test the historical level of 1.2234 (blue dotted line) and then start moving down, with the lower target of 1.2178 – a pullback level of 14.6% (red dotted line). Simplified wave analysis and forecast for GBP/USD, USD/JPY, and USD/CHF on December 28 2020-12-28 GBP/USD Analysis: The last section of the trend of the British pound sterling counts down from September 10. In its structure, an intermediate correction was completed a week ago, in the form of a stretched plane. On December 21, a new wave of the main course started. Forecast: Today, in the first half of the day, a flat with a general downward vector is most likely. At the end of the day, the exchange rate is expected to change in the area of settlement support and return to the bullish trend. Potential reversal zones Resistance: - 1.3610/1.3630 Support: - 1.3510/1.3480 Recommendations: Selling the pound today is possible, however, it is worth considering the limited potential for decline. It is safer to refrain from entering the market during the correction and look for buy signals in the support area. 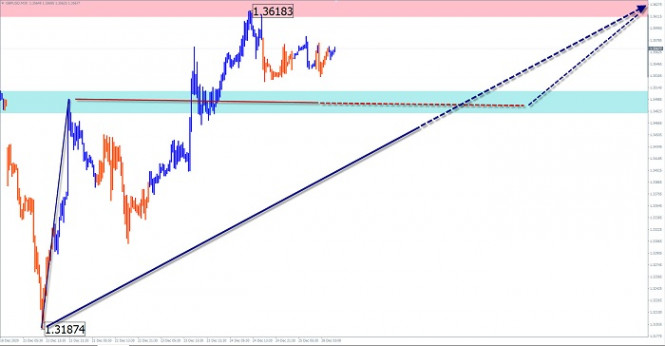
USD/JPY Analysis: The direction of the short-term trend of the Japanese yen is set by the descending algorithm of November 9. The last unfinished section has been reporting since December 21. In the structure of this wave, the middle part (B) is formed. Forecast: During the next sessions, the correction phase of the movement is expected to be fully completed. In the second half of the day, you can expect a reversal and a return to the downward rate. The upper limit of the support zone shows the probable potential of the daily movement down. Potential reversal zones Resistance: - 103.70/104.00 Support: - 103.10/102.80 Recommendations: There are no conditions for purchases today. It is recommended to look for signals for selling the instrument in the area of the calculated resistance. 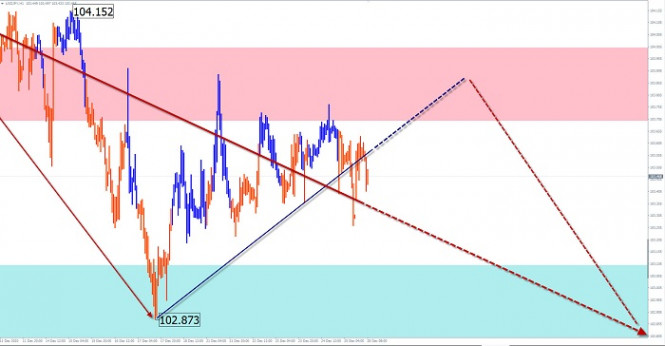
USD/CHF Analysis: The direction of the Swiss franc trend since March is set by the daily-scale descending wave algorithm. The last segment has been reporting since November 11. It has been forming an intermediate correction for the entire past month. Forecast: In the next day, it is expected to complete the upward course of the movement, turn around and return to the bearish rate. If the direction changes, an increase in volatility is not excluded, with a short-term puncture of the upper limit of the calculated resistance. Potential reversal zones Resistance: - 0.8920/0.8950 Support: - 0.8850/0.8820 Recommendations: Purchases of the franc today can be unprofitable. It is recommended to track reversal signals at the end of the current rise to enter short positions. 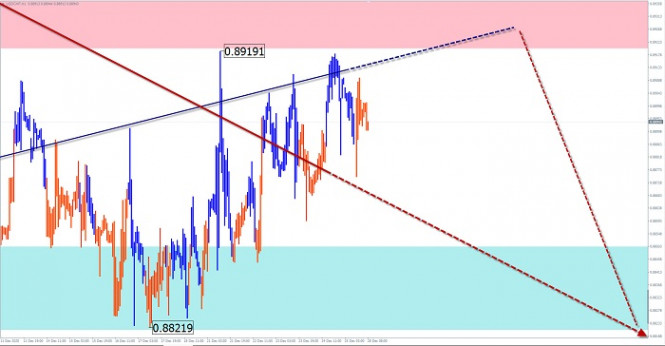
Explanation: In the simplified wave analysis (UVA), waves consist of 3 parts (A-B-C). The last incomplete wave is analyzed. The solid background of the arrows shows the formed structure, and the dotted one shows the expected movements. Attention: The wave algorithm does not take into account the duration of the instrument's movements in time! Indicator analysis. Daily review for the GBP/USD currency pair on 28/12/2020 2020-12-28 Trend analysis (figure 1). Today, from the level of 1.3533 (the closing of Thursday's daily candle), the market can continue to move up with the target of 1.3623 upper fractal (red dotted line). Upon reaching this level, work up with a target of 1.3676 which is a pullback level of 76.4% (yellow dotted line). After testing this line, continue to work up with the target of 1.3944 which is a pullback level of 85.4% (yellow dotted line). 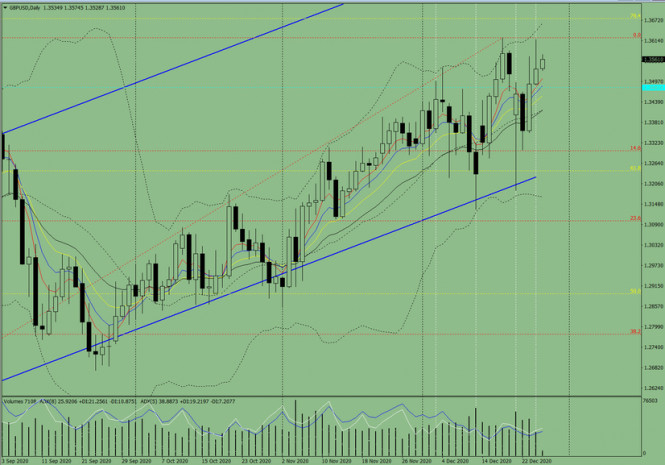 Figure 1 (daily chart). Comprehensive Analysis: - Indicator Analysis – up
- Fibonacci Levels – up
- Volumes – up
- Candle Analysis – up
- Trend Analysis – up
- Bollinger Bands – down
- Weekly Chart – up
General Conclusion: Today, the price can continue to move up with a target of 1.3623 upper fractal (red dotted line). Upon reaching this level, work up with a target of 1.3676 which is a pullback level of 76.4% (yellow dotted line). After testing this line, continue to work up with the target of 1.3944 which is a pullback level of 85.4% (yellow dotted line). Alternative scenario: From the level of 1.3533 (the closing of the Thursday's daily candle) the price may continue to move up with the target at 1.3623 upper fractal (red dotted line). From this level, work down with a target of 1.3481 which is the historical support level (blue dotted line). Technical Analysis of GBP/USD for December 28, 2020 2020-12-28 Technical Market Outlook: The GBP/USD pair has moved higher towards the recent swing high seen at the level of 1.3624, but no breakout occurred just yet. The bullish pressure is clear and if the swing high is broken, then the next target is seen at the level of 1.3667 and 1.3708. Please notice, the market conditions are now overbought, so a pull back towards the intraday support located at 1.3515 and 1.3538 is welcome. The momentum remains strong and positive, which supports the short term bullish outlook. Weekly Pivot Points: WR3 - 1.4170 WR2 - 1.3890 WR1 - 1.3745 Weekly Pivot - 1.3458 WS1 - 1.3319 WS2 - 1.3039 WS3 - 1.2880 Trading Recommendations: The GBP/USD pair might have started a long term up trend and the trigger for this trend was the breakout above the level or 1.3518 on the weekly time frame chart. All the local corrections should be used to enter a buy orders as long as the level of 1.2674 is not broken. The long-term target for bulls is seen at the level of 1.4370. 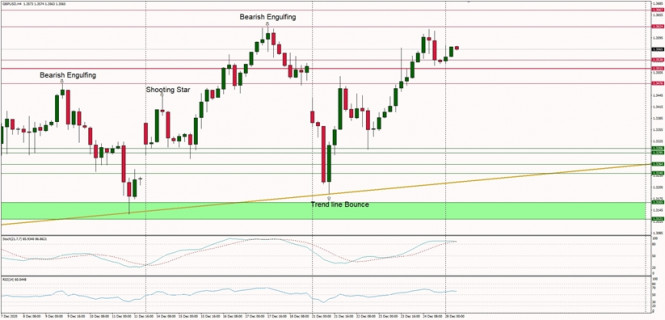
Technical Analysis of EUR/USD for December 28, 2020 2020-12-28 Technical Market Outlook: The EUR/USD pair has bounced from the level of 1.2154 again and is currently heading higher towards the swing high seen at 1.2272. The Broadening Wedge price pattern is still in progress, so please notice this particular pattern is a trend reversal pattern, which indicated a possible correction on the Euro market soon. For now, the zone located between the levels of 1.2154 - 1.2177 remains the key demand zone for bulls. The positive momentum supports the short-term bullish outlook as long as the demand zone is not clearly violated. Weekly Pivot Points: WR3 - 1.2368 WR2 - 1.2314 WR1 - 1.2240 Weekly Pivot - 1.2185 WS1 - 1.2118 WS2 - 1.2062 WS3 - 1.1987 Trading Recommendations: Since the middle of March 2020 the main trend is on EUR/USD pair has been up. This means any local corrections should be used to buy the dips until the key technical support is broken. The key long-term technical support is seen at the level of 1.1609. The key long-term technical resistance is seen at the level of 1.2555. 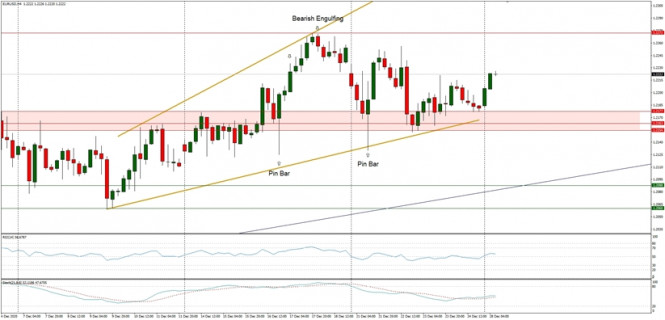
Technical analysis for EUR/USD pair for the week of December 28-31, 2020 2020-12-28 Trend analysis The price from the level of 1.2181 (closing of the last weekly candle) may start rising to the pullback level of 85.4% - 1. 2272 (blue dotted line) this week. Upon reaching this level, the upward movement will continue to the next target of 1.2462 (blue dotted line) – the historical resistance level. 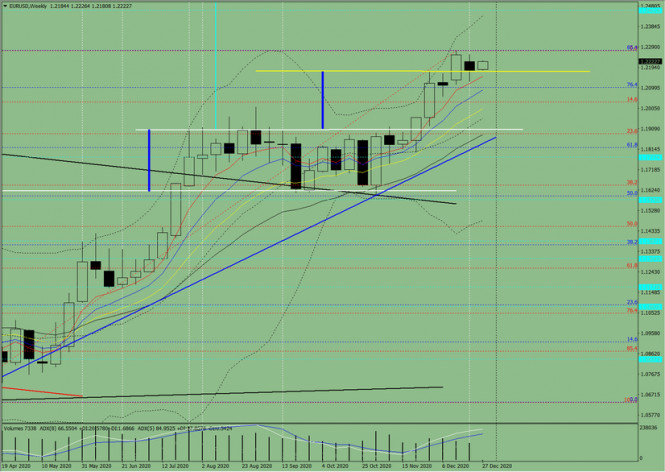
Figure 1 (weekly chart) Comprehensive analysis: - Indicator analysis - up
- Fibonacci levels - up
- Volumes - up
- Candlestick analysis - up
- Trend analysis - up
- Bollinger lines - up
- Monthly chart - up
An upward movement can be concluded based on comprehensive analysis. The overall result of the candlestick calculation on the weekly chart: the price is likely to have an upward trend this week, without a lower shadow in the weekly white candlestick (Monday - up) and no upper shadow (Thursday - up). The first upper target is 1.2272 – a pullback level of 85.4% (blue dotted line). Upon reaching this level, the upward movement is expected to continue to the target of 1.2462 (blue dotted line) – the historical resistance level. An alternative scenario: the price from the level of 1.2181 (closing of the last weekly candle) will move upwards to the target of 1.2272 – a pullback level of 85.4% (blue dotted line). After reaching this level, it can decline to the target of 1.2033 – a pullback level of 14.6% (red dotted line). Technical analysis for GBP/USD pair for the week of December 28-31, 2020 2020-12-28 Last week, the pound/dollar pair declined, tested the support line of 1.3188 (white bold line) and then moved up, almost reaching the upper fractal of 1.3623 (weekly candle from 12/13/20) – red dotted line. The weekly candle closed at the level of 1.3533, which is just above the historical support level of 1.3511 (blue dotted line). This week, the price will most likely continue to move up. Trend analysis This week, the price from the level of 1.3533 (closing of the last weekly candle) will move up to the target of 1.3623 (red dotted line) – upper fractal (weekly candle from 12/13/2020). If this line is tested, the upward movement can continue to the target of 1.36751 – the pullback level of 76.4% (blue dotted line). The final target of the weekly candle is the resistance line of 1.3855 (white thick line). 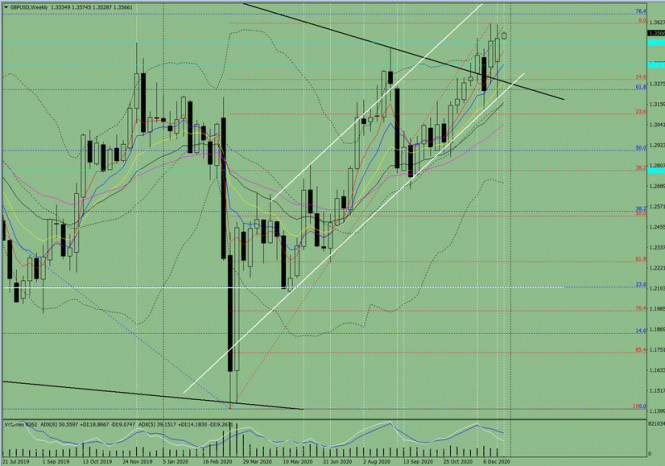
Figure 1 (weekly chart) Comprehensive analysis: - Indicator analysis - up
- Fibonacci levels - up
- Volumes - up
- Candlestick analysis - up
- Trend analysis - up
- Bollinger lines - up
- Monthly chart - up
An upward movement can be concluded based on comprehensive analysis. The overall result of the candlestick calculation on the weekly chart: the price is likely to have an upward trend this week, without the first lower shadow in the weekly white candlestick (Monday - up) and without the second upper shadow (Friday - high). The first upside target is the upper fractal of 1.3623 (weekly candle from 12/13/2020) – red dotted line. Upon testing this line, the upward movement can continue to the target of 1.36751 – the pullback level of 76.4% (blue dotted line). The final target of the weekly candle is the resistance line of 1.3855 (white thick line). An alternative scenario: the price from the level of 1.3533 (closing of the last weekly candle) may rise to the target of 1.3623 (red dotted line) – upper fractal (weekly candle from 12/13/20). In case of testing this line, move down to the target of 1.3511 – the historical support level (blue dotted line). GBP/USD. December 28. COT report. Trade deal agreed. Now, a 1240-page document will be considered by both parliaments 2020-12-28 GBP/USD – 1H. 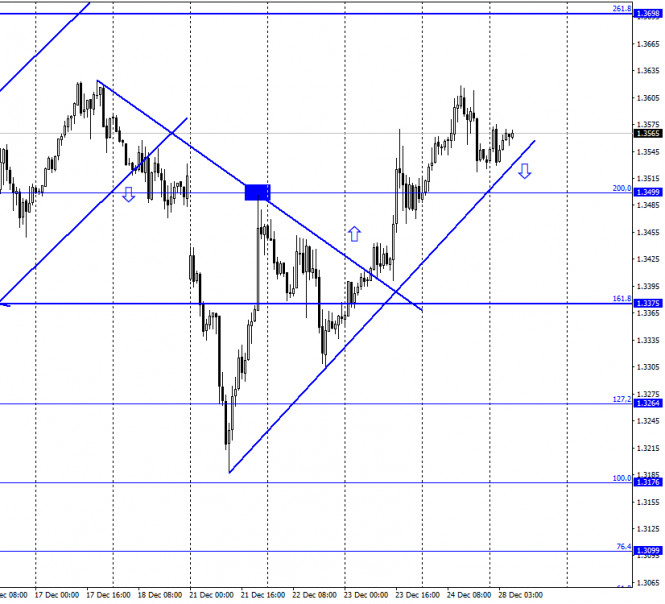
According to the hourly chart, the quotes of the GBP/USD pair were trading near the ascending trend line on the night of December 28, which still characterizes the current mood of traders as "bullish". Thus, the growth process can be resumed in the direction of the corrective level of 261.8% (1.3698). Fixing the quotes under the trend line will allow traders to expect a reversal in favor of the US currency and some fall in the direction of the corrective level of 161.8% (1.3375). The tension eased from the traders. The trade deal has been agreed and now no one doubts that both parliaments will ratify it. Thus, it remains only to wait for the official results of the vote of both parliaments. Britain will meet in an emergency meeting on December 30 to vote on the 1,240-page bill. The European Parliament will vote after the New Year, however, the European Union will still be able to temporarily accept the agreement to avoid a "hard" Brexit from January 1. Thus, this whole series is left behind, and traders will now analyze the state of the UK economy in late 2020 and early 2021. The deal is good, however, many experts still believe that the UK economy will shrink in the coming months. The Bank of England has said it expects GDP to fall by 1% in the first quarter of next year. So Britain's financial problems will not go away, they will simply not be as complex and disruptive as they might have been without a deal. GBP/USD – 4H. 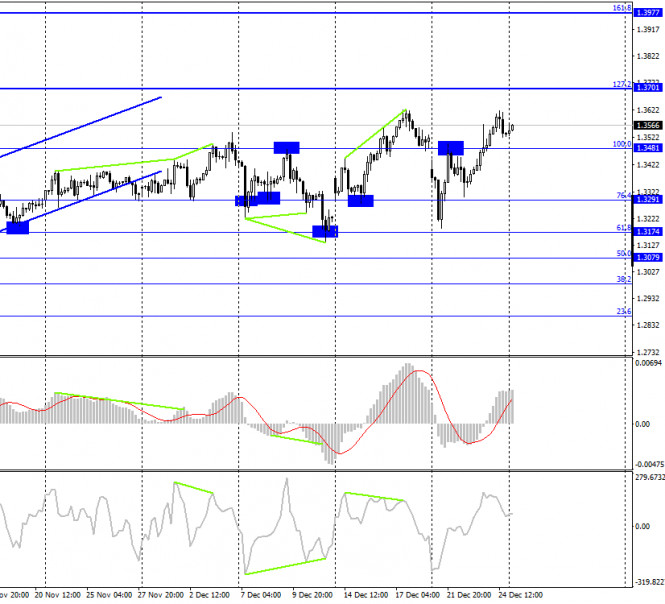
On the 4-hour chart, the GBP/USD pair continues to grow in the direction of the corrective level of 127.2% (1.3701). The rebound of quotes from this level will work in favor of the US dollar and some fall in the direction of the Fibo level of 100.0% (1.3481). Today, the divergence is not observed in any indicator. GBP/USD – Daily. 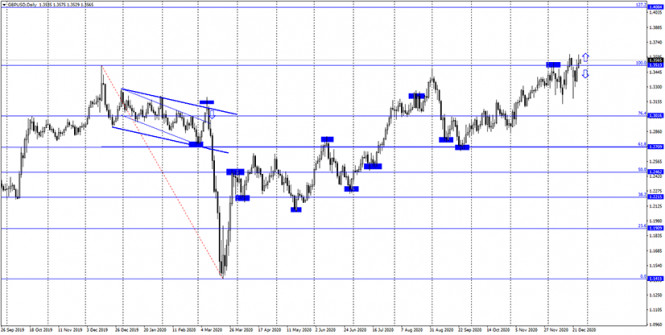
On the daily chart, the pair's quotes returned to the corrective level of 100.0% (1.3513). The rebound of the exchange rate from this level will again work in favor of the US currency and the beginning of a new fall in the direction of the Fibo level of 76.4% (1.3016). GBP/USD – Weekly. 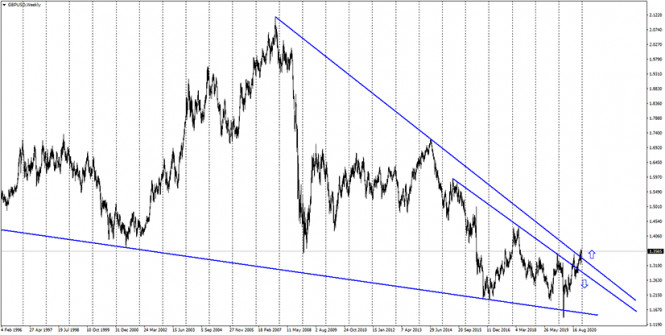
On the weekly chart, the pound/dollar pair performed an increase to the second downward trend line. A rebound from it in the long term will mean a reversal in favor of the US dollar and a long fall in the British dollar's quotes. Overview of fundamentals: On Friday, there were no economic reports in the UK and the US, and trading on this day was not conducted. The information background was completely absent. The economic calendar for the US and the UK: On December 28, the calendar of economic events in the UK and the US are empty. The information background will be absent today. COT (Commitments of Traders) report: 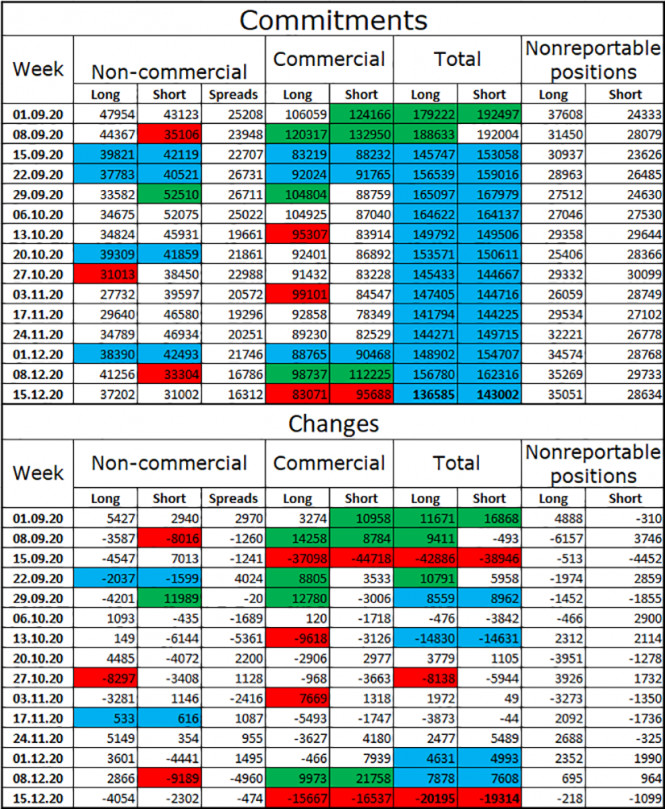
The latest COT report showed that speculators were getting rid of both long and short contracts. This again suggests that traders are afraid of the British and the information background. It is extremely difficult to predict what will happen to the UK economy in 2021. Therefore, the "Non-commercial" category of traders prefers to close trades rather than open new ones. This time, speculators closed 4 thousand long contracts and 2.5 thousand short contracts. Thus, the mood of speculators has become much less "bullish". At the same time, the British continued the growth process, thus, I can draw the same conclusion as for the euro. Major traders are preparing for a new fall in the pound sterling. GBP/USD forecast and recommendations for traders: It is recommended to open new purchases of the British dollar on Monday in case of a rebound from the ascending trend line on the hourly chart with the target level of 261.8% (1.3698). I recommend selling the pound sterling when it is fixed under the ascending trend line on the hourly chart with a target of 1.3375. Terms: "Non-commercial" - major market players: banks, hedge funds, investment funds, private, large investors. "Commercial" - commercial enterprises, firms, banks, corporations, companies that buy currency, not for speculative profit, but to ensure current activities or export-import operations. "Non-reportable positions" - small traders who do not have a significant impact on the price. Trading recommendations for starters on GBP/USD and EUR/USD for December 28, 2020 2020-12-28 The past trading week ended with a day off with respect to the Christmas celebration. But before this day, one of the most important events for the UK and Europe was held. The parties managed to agree on a trade agreement after Brexit, which became a commotion this year. It took four and a half years for a trade deal, so it's hard to believe that everything was over. What happened on the trading chart? The pound sterling broke up on expectations of a positive Brexit result, reaching the area of the local high of the medium-term upward trend. However, as buyers reached the 1.3600/1.3625 area, they failed to update the high. Perhaps, there were not enough trading volumes due to the early closure of trading floors or the news was already played by the market. After all, the quote only pulled back about 80 points from the high. The euro/dollar, where market dynamics were not observed, showed a consistent fluctuation at the peak of the medium-term upward trend, without any sharp price changes. It is possible that traders are out for the holidays. 
Trading recommendation for GBP/USD on December 28 Markets are open today, but some countries of the British Commonwealth – UK, Canada, Australia and New Zealand are celebrating Boxing Day. Due to the weekend, low trading volumes can be expected and so, traders will try to follow agreeing a trade deal. Perhaps, there will be new details that will act as a catalyst for trading activity. The market will remain in one place, conditionally in the range of 1.3520/1.3620, if nothing interesting appears in the media. 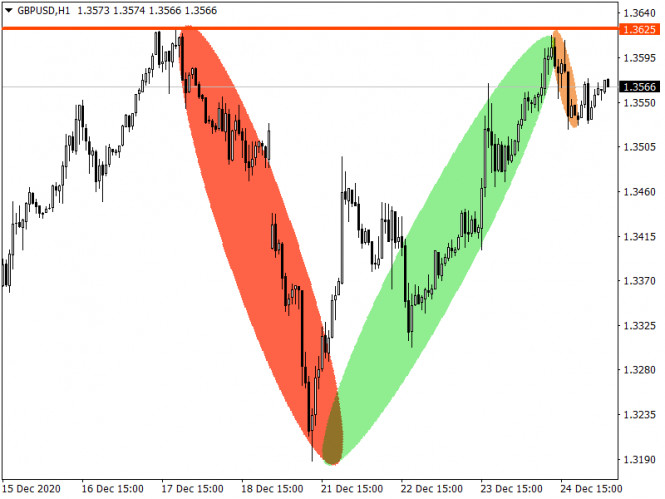
Trading recommendation for EUR/USD on December 28 Today, Europe has come to work, but no statistics worth noting are expected. Therefore, traders will discuss the Brexit deal and the timing of its ratification. The amplitude fluctuation of the price in the range of 1.2150/1.2275 will still remain the main movement, possibly until the end of the trading week. 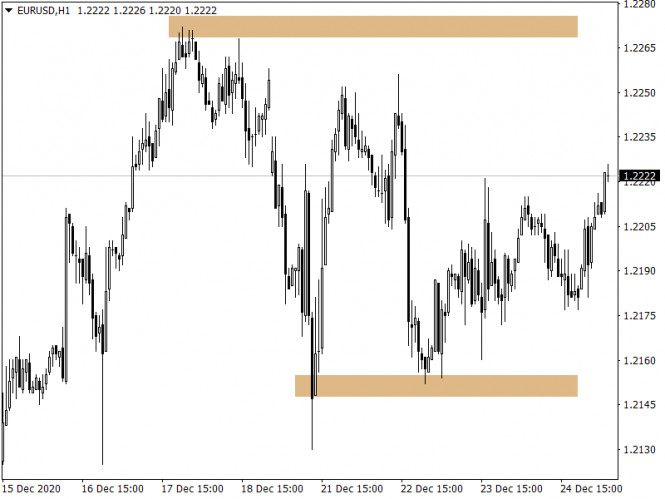
Forex forecast 12/28/2020 on EUR/USD, AUD/USD, NZD/USD, Oil, BTC/USD, ETH/USD from Sebastian Seliga 2020-12-28 Due to the almost empty event calendar for today, let's take a look at the technical picture of EUR/USD, AUD/USD, NZD/USD, Crude Oil, Bitcoin and Ethereum. GBP/USD and EUR/USD: The Brexit trade deal improves the economic outlook of UK. Trump signs the $900 billion bailout bill. 2020-12-28 A Brexit trade agreement has been concluded. Its negotiations, which lasted more than six months, fortunately bore fruit and led to a deal that would help the UK avoid the economic shocks that it would have faced in 2021, as breaking ties with the EU would not bring it anything good, especially since the country is already dealing with a new type of coronavirus. The deal has also eased the burden from the Bank of England, and its new terms will take effect starting January 1, 2021. Now, companies and businesses that do bilateral trade will need to adjust to the new rules, that is, a trade turnover of approximately $ 900 billion per year. Most likely, the agreement will improve consumer and business sentiment, which declined sharply this year due to the COVID-19 crisis. A further increase in business confidence, which has remained strong even amid the pandemic, will definitely spur stronger economic activity. And in addition, in the medium term, demand for the pound should increase because of the new deal. The agreement is now waiting to be signed by the EU leaders, followed by the European and British parliaments. If the bill is finally ratified, there will be a new customs regime, monitoring and forms, which will end the free access of goods and the old trade relations that have been in place since the 1970s. This will lead to disruptions in ports and, quite possibly, even a shortage of food in supermarkets. Disruption to supply chains will also affect business activity, leading to slower economic growth and higher prices. 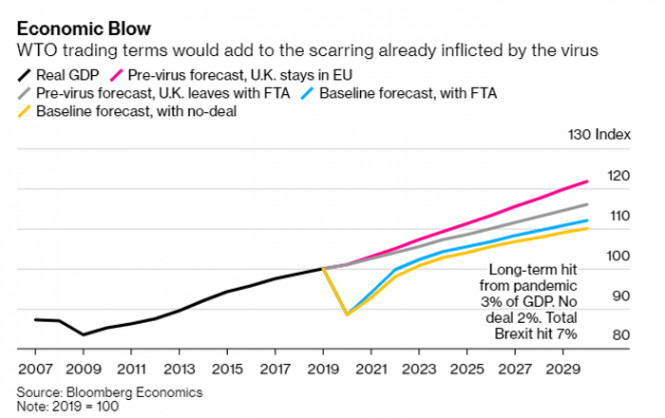
But in the longer term, the new agreement avoids a scenario where the UK would see a 1.5% decrease in output in 2021, which would only exacerbate the expected recession due to the latest restrictions imposed because of the new coronavirus strain. The new outlook, as a result of the Brexit agreement, provides for more robust economic growth that is 0.5% above the baseline scenario. As for the GBP / USD pair, though demand may slow down due to the tougher quarantine restrictions, the upward potential remains quite high. A breakout from 1.3625 will most likely lead to a stronger jump towards 1.3690 and 1.3750, or even towards the 38th figure. But if the quote moves below 1.3535, the pound will collapse to 1.3475 and below. USD: US President Donald Trump signed the 2021 budget over the weekend, including the $ 900 billion bailout bill. According to the White House, the president signed the bill in the original form in which it was agreed. Therefore, Americans will receive $ 600 per person next year, not $ 2,000 which Trump requested earlier. Nonetheless, the signing of the document indicates that negotiations on additional economic assistance, which the US economy urgently needs now, will continue. The new aid package also includes $ 1.4 trillion, which will go to the budget that supports the work of the US government. Thus, the amount of $ 2.3 trillion, which was so criticized by Trump and which became a problem this summer, was still approved. 
Although the Democrats prefer a larger bill, they have to support Trump's decision. Last Sunday, House Speaker Nancy Pelosi said, "Every vote against the new bill is a vote to deny the financial difficulties that families face. It also denies Americans the help they need." Both the Democrats and Republicans agree with the need for payments, but according to Trump, it is clear that no one wants to throw money around. Meanwhile, President-elect Joe Biden recently announced that after taking office early next year, he will push for even more stimulus. However, it remains unclear whether the Republicans, who so far control the Senate, will agree to this. With regards to the EUR / USD pair, a breakout from 1.2175 will most likely lead to a sharp decline towards 1.2080 and 1.2040. But if the quote consolidates above 1.2220, the EUR / USD pair may rise to 1.2260 and then to 1.2310. CAD: The Canadian dollar remained trading in a sideways channel after data emerged that building permits in Canada rose 12.9% in November, up from its figure in the previous month. At the same time, the data for October was revised upward to -12.6%, which is better than its previous estimate of -14.6%. Compared to the same period last year, building permits increased by 16.2%. Therefore, in the USD/CAD pair, only a breakout from 1.2820 will lead to a sharp decline towards 1.2770 and 1.2690. But if the quote consolidates at 1.2885, the USD/CAD pair may go to 1.2955.
Author's today's articles: Maxim Magdalinin  In 2005 graduated from the Academy of the Ministry of Internal Affairs of the Republic of Belarus, law faculty. Worked as a lawyer for three years in one of the biggest country's company. Besides the trading, he develops trading systems, writes articles and analytical reviews. Works at stock and commodity markets explorations. On Forex since 2006. In 2005 graduated from the Academy of the Ministry of Internal Affairs of the Republic of Belarus, law faculty. Worked as a lawyer for three years in one of the biggest country's company. Besides the trading, he develops trading systems, writes articles and analytical reviews. Works at stock and commodity markets explorations. On Forex since 2006. Sergey Belyaev  Born December 1, 1955. In 1993 graduated from Air Force Engineering Academy. In September 1999 started to study Forex markets. Since 2002 has been reading lectures on the technical analysis . Is fond of research work. Created a personal trading system based on the indicator analysis. Authored the book on technical analysis "Calculation of the next candlestick". At present the next book is being prepared for publishing "Indicator Analysis of Forex Market. Trading System Encyclopedia". Has created eleven courses on indicator analysis. Uses classical indicators. Works as a public lecturer. Held numerous seminars and workshops presented at international exhibitions of financial markets industry. Is known as one of the best specialists in the Russian Federation researching indicator analysis. Born December 1, 1955. In 1993 graduated from Air Force Engineering Academy. In September 1999 started to study Forex markets. Since 2002 has been reading lectures on the technical analysis . Is fond of research work. Created a personal trading system based on the indicator analysis. Authored the book on technical analysis "Calculation of the next candlestick". At present the next book is being prepared for publishing "Indicator Analysis of Forex Market. Trading System Encyclopedia". Has created eleven courses on indicator analysis. Uses classical indicators. Works as a public lecturer. Held numerous seminars and workshops presented at international exhibitions of financial markets industry. Is known as one of the best specialists in the Russian Federation researching indicator analysis. Vyacheslav Ognev  Vyacheslav was born on August 24, 1971. In 1993, he graduated from Urals State University of Economics in the Russian city of Ekaterinburg holding a degree in Commerce and Economics of Trade. In 2007, he started concentrating on the Russian stock market, trading stocks on the RTS Stock Exchange and futures contracts on FORTS. Since 2008 he has been engaged in analyzing Forex market and trading currencies. He is an author of a simplified wave analysis method. He has also developed a trading strategy. At present, Vyacheslav is a co-author of training materials on two web portals dedicated to Forex trading education. Interests: fitness, F1 "Experience is the best of schoolmasters, only the school fees are heavy." - Thomas Carlyle Vyacheslav was born on August 24, 1971. In 1993, he graduated from Urals State University of Economics in the Russian city of Ekaterinburg holding a degree in Commerce and Economics of Trade. In 2007, he started concentrating on the Russian stock market, trading stocks on the RTS Stock Exchange and futures contracts on FORTS. Since 2008 he has been engaged in analyzing Forex market and trading currencies. He is an author of a simplified wave analysis method. He has also developed a trading strategy. At present, Vyacheslav is a co-author of training materials on two web portals dedicated to Forex trading education. Interests: fitness, F1 "Experience is the best of schoolmasters, only the school fees are heavy." - Thomas Carlyle Sebastian Seliga  Sebastian Seliga was born on 13th Oсtober 1978 in Poland. He graduated in 2005 with MA in Social Psychology. He has worked for leading financial companies in Poland where he actively traded on NYSE, AMEX and NASDAQ exchanges. Sebastian started Forex trading in 2009 and mastered Elliott Wave Principle approach to the markets by developing and implementing his own trading strategies of Forex analysis. Since 2012, he has been writing analitical reviews based on EWP for blogs and for Forex websites and forums. He has developed several on-line projects devoted to Forex trading and investments. He is interested in slow cooking, stand-up comedy, guitar playing, reading and swimming. "Every battle is won before it is ever fought", Sun Tzu Sebastian Seliga was born on 13th Oсtober 1978 in Poland. He graduated in 2005 with MA in Social Psychology. He has worked for leading financial companies in Poland where he actively traded on NYSE, AMEX and NASDAQ exchanges. Sebastian started Forex trading in 2009 and mastered Elliott Wave Principle approach to the markets by developing and implementing his own trading strategies of Forex analysis. Since 2012, he has been writing analitical reviews based on EWP for blogs and for Forex websites and forums. He has developed several on-line projects devoted to Forex trading and investments. He is interested in slow cooking, stand-up comedy, guitar playing, reading and swimming. "Every battle is won before it is ever fought", Sun Tzu Grigory Sokolov  Born 1 January, 1986. In 2008 graduated from Kiev Institute of Business and Technology with "Finance and Credit" as a major. Since 2008 has studied the behavior of various currency pairs and their correlation on Forex. In his works and trading practice he uses candlestick analysis and Fibonacci technique. Since 2009 has written analytical reviews and articles which are published on popular Internet resources. Interests: music, computers and cookery. "Out of five deadly sins of business and as a rule, the most widespread, excessive striving to get profit is the worst". P. Drucker Born 1 January, 1986. In 2008 graduated from Kiev Institute of Business and Technology with "Finance and Credit" as a major. Since 2008 has studied the behavior of various currency pairs and their correlation on Forex. In his works and trading practice he uses candlestick analysis and Fibonacci technique. Since 2009 has written analytical reviews and articles which are published on popular Internet resources. Interests: music, computers and cookery. "Out of five deadly sins of business and as a rule, the most widespread, excessive striving to get profit is the worst". P. Drucker Vladislav Tukhmenev  Vladislav graduated from Moscow State University of Technologiy and Management. He entered the forex market in early 2008. Vladislav is a professional trader, analyst, and manager. He applies a whole gamut of analysis – technical, graphical, mathematical, fundamental, and candlestick analysis. Moreover, he forecasts the market movements using his own methods based on the chaos theory. Vladimir took part in development of trading systems devoted to fractal analysis. In his free time, Vladimir blogs about exchange markets. Hobbies: active leisure, sporting shooting, cars, design, and marketing. "I do not dream only of becoming the best in my field. I also dream about those who I will take with me along the way up." Vladislav graduated from Moscow State University of Technologiy and Management. He entered the forex market in early 2008. Vladislav is a professional trader, analyst, and manager. He applies a whole gamut of analysis – technical, graphical, mathematical, fundamental, and candlestick analysis. Moreover, he forecasts the market movements using his own methods based on the chaos theory. Vladimir took part in development of trading systems devoted to fractal analysis. In his free time, Vladimir blogs about exchange markets. Hobbies: active leisure, sporting shooting, cars, design, and marketing. "I do not dream only of becoming the best in my field. I also dream about those who I will take with me along the way up." Pavel Vlasov  No data No data
Subscription's options management Theme's:
Fundamental analysis, Fractal analysis, Wave analysis, Technical analysis, Stock Markets
Author's :
A Zotova, Aleksey Almazov, Alexander Dneprovskiy, Alexandr Davidov, Alexandros Yfantis, Andrey Shevchenko, Arief Makmur, Dean Leo, Evgeny Klimov, Fedor Pavlov, Grigory Sokolov, I Belozerov, Igor Kovalyov, Irina Manzenko, Ivan Aleksandrov, l Kolesnikova, Maxim Magdalinin, Mihail Makarov, Mohamed Samy, Mourad El Keddani, Oleg Khmelevskiy, Oscar Ton, Pavel Vlasov, Petar Jacimovic, R Agafonov, S Doronina, Sebastian Seliga, Sergey Belyaev, Sergey Mityukov, Stanislav Polyanskiy, T Strelkova, Torben Melsted, V Isakov, Viktor Vasilevsky, Vladislav Tukhmenev, Vyacheslav Ognev, Yuriy Zaycev, Zhizhko Nadezhda
Edit data of subscription settings
Unsubscribe from the mailing list Sincerely,
Analysts Service | If you have any questions, you can make a phone call using one of the
InstaForex Toll free numbers right now:
|  | InstaForex Group is an international brand providing online trading services to the clients all over the world. InstaForex Group members include regulated companies in Europe, Russia and British Virgin Islands. This letter may contain personal information for access to your InstaForex trading account, so for the purpose of safety it is recommended to delete this data from the history. If you have received this letter by mistake, please contact InstaForex Customer Relations Department. |


No comments:
Post a Comment