| Trading plan for EUR/USD for December 31, 2020 2020-12-31 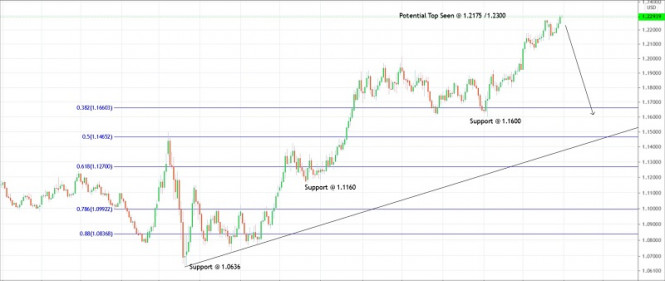
Technical outlook: EUR/USD hovers around the 1.2300 levels for now as the currency faces resistance at 1.2300/10 zone. The single currency pair is seen to be trading around 1.2290/95 levels at this point of writing and is expected to drop lower anytime soon. Immediate price resistance is seen around 1.2310/20, while support comes in at 1.2190, followed by 1.2130 levels respectively. A break below 1.2130 certainly confirms a meaningful top in place and signals that bears are back in control. EUR/USD had dropped through fresh yearly lows around 1.0636 levels before turning higher. Since then, bulls had remained in control, printing higher highs and higher lows through 1.2310 levels yesterday. High probability remains for a bearish turn from these levels. On the flip side, if bulls continue pushing higher, the currency might reach the 1.2500 mark in the next few trading sessions. A drop below 1.2130 is crucial for bears to regain control. Trading plan: Remain short with stop around 1.2450 levels, target at 1.1600. Good luck! Trading plan for USD/JPY for December 31, 2020 2020-12-31 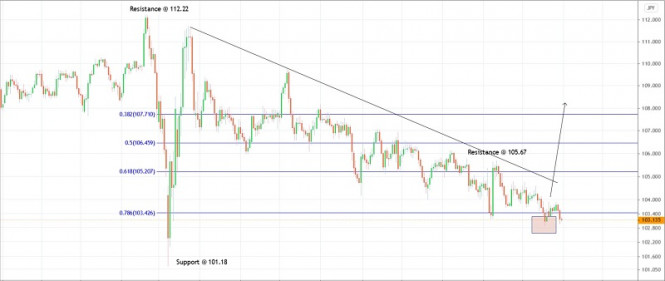
Technical outlook: USD/JPY dropped yesterday through the 102.96 levels before facing support again. The drop might be seen as a correction of the previous rally between the 102.87 and 103.90 levels respectively. The single currency pair is seen to be trading around the 103.12 levels at this point of writing and is expected to resume its rally until 102.87 remains intact. Immediate price support is seen around 102.80 while resistance is at 104.00 (intermediary), followed by 105.50 levels respectively. The overall wave structure looks constructive for bulls but we need to see a breakout above 105.50 at least to confirm that a meaningful low is in place. The above daily chart structure also remains favorable to bulls until prices stay above March 2020 lows at the 101.18 levels going forward. The entire rally between 101.18 and 111.75 has retraced to fibonacci 0.786 levels as depicted here. If bulls are to take control back, it should be from here. Any drop below 102.87 would test 102.50 and also 101.18 levels respectively. Trading plan: Remain long with stop @ 101.18, target is at 105.00, 109.00 and higher. Good luck! Trading plan for GBP/USD for December 31, 2020 2020-12-31 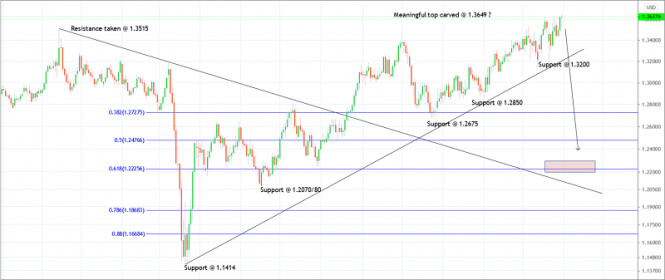
Technical outlook: GBP/USD has managed to print fresh highs today around the 1.3649 mark before pulling back. The single currency is seen to be trading around the 1.3627 levels at this point of writing and might be preparing to continue lower towards the1.3400 levels in the short term. Immediate price resistance is seen around the 1.3650/70 zone, while support comes in at 1.3430, followed by 1.3200 respectively. A drop below 1.3400 could be seen as confirmation of a meaningful top in place around 1.3649 today. The wave structure depicted on a daily chart here looks mature, and a break below 1.3200 from here might trigger further selloff. Also note that prices would break below its March 2020 trend line support if bears are successful to take out the 1.3200 support. Furthermore, potential remains for a drop to materialize towards the 1.2200 zone, which is fibonacci 0.618 retracement of the entire rally between 1.1414 through the 1.3649 levels respectively. Trading plan: Remain short with stop above 1.3700, target is at 1.2200 Good luck! Trading plan for USD/CHF for December 31, 2020 2020-12-31 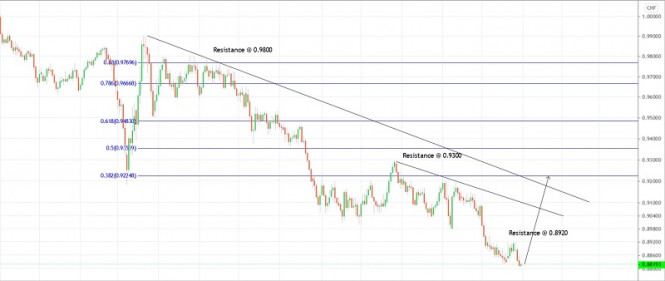
Technical outlook: USDC/HF might have carved a bottom just above the 0.8800 levels today or is very close to carving soon. The single currency pair is seen to be trading around the 0.8818 levels at this point of writing and is expected to resume the rally towards the 0.9200 levels over the next few weeks. Immediate price resistance is seen towards 0.8920, while intermediary support comes in at the 0.8800 levels respectively. A breakout above 0.8920 would also confirm that bulls are back in control and a meaningful bottom is now in place. Please note that USD/CHF has been in downtrend since March 2020 highs around the 0.9900 levels. The overall bearish trend looks to be mature now, and USD/CHF is expected to produce a meaningful corrective rally at least towards the 0.9500 mark, which is fibonacci 0.618 retracement of the entire drop between the 0.9900 and 0.8800 levels respectively. Bulls might be inclined to take control back over the next several weeks. Trading plan: Remain long with stop below 0.8700, targeting at 0.9500. Good luck! Technical Analysis of GBP/USD for December 31, 2020 2020-12-31 Technical Market Outlook: The GBP/USD pair has finally broken out of the consolidation zone and made a new marginal high located at the level of 1.3648. The local low during the recent the pull-back was made at the level of 1.3428 and will now act as a key short-term technical support. Nevertheless, the bullish pressure is clear, and if the swing high is broken, then the next target is seen at the level of 1.3667 and 1.3708. Please notice, the market is coming off the overbought conditions, so a horizontal range trading might be still in progress. The momentum remains strong and positive, which supports the short term bullish outlook. Weekly Pivot Points: WR3 - 1.4170 WR2 - 1.3890 WR1 - 1.3745 Weekly Pivot - 1.3458 WS1 - 1.3319 WS2 - 1.3039 WS3 - 1.2880 Trading Recommendations: The GBP/USD pair might have started a long term up trend and the trigger for this trend was the breakout above the level or 1.3518 on the weekly time frame chart. All the local corrections should be used to enter a buy orders as long as the level of 1.2674 is not broken. The long-term target for bulls is seen at the level of 1.4370. 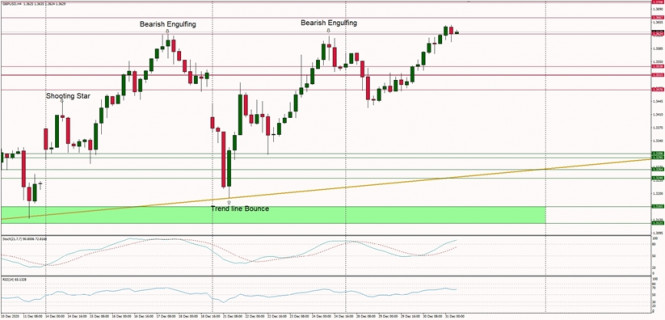
Technical Analysis of EUR/USD for December 31, 2020 2020-12-31 Technical Market Outlook: The EUR/USD pair has broken above the last swing high located at the level of 1.2272 and made a new swing high at the level of 1.2309 (at the time of writing the article). Nevertheless, the Broadening Wedge price pattern is still in progress, so please notice that this particular pattern is a trend reversal pattern, which indicates a possible correction on the Euro market soon. For now, the zone located between the levels of 1.2154 - 1.2177 remains the key demand zone for bulls. The positive momentum supports the short-term bullish outlook as long as the demand zone is not clearly violated. The next target for bulls is seen at the level of 1.2555, but due to the overbought market conditions we might see some corrective move first. Weekly Pivot Points: WR3 - 1.2368 WR2 - 1.2314 WR1 - 1.2240 Weekly Pivot - 1.2185 WS1 - 1.2118 WS2 - 1.2062 WS3 - 1.1987 Trading Recommendations: Since the middle of March 2020 the main trend is on EUR/USD pair has been up. This means any local corrections should be used to buy the dips until the key technical support is broken. The key long-term technical support is seen at the level of 1.1609. The key long-term technical resistance is seen at the level of 1.2555. 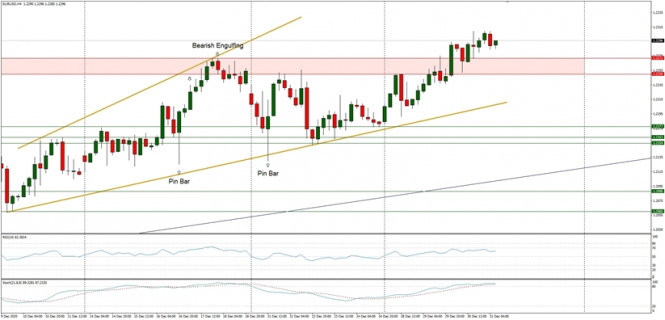
Forex forecast 12/31/2020 on AUD/USD, NZD/USD, EUR/USD and Bitcoin from Sebastian Seliga 2020-12-31 Let's take a look at the technical analysis of AUD/USD/NZD/USD, EUR/USD and Bitcoin in the last trading day of 2020. Analytics and trading signals for beginners. How to trade GBP/USD on December 31? Plan for opening and closing deals on Thursday 2020-12-31 Hourly chart of the GBP/USD pair 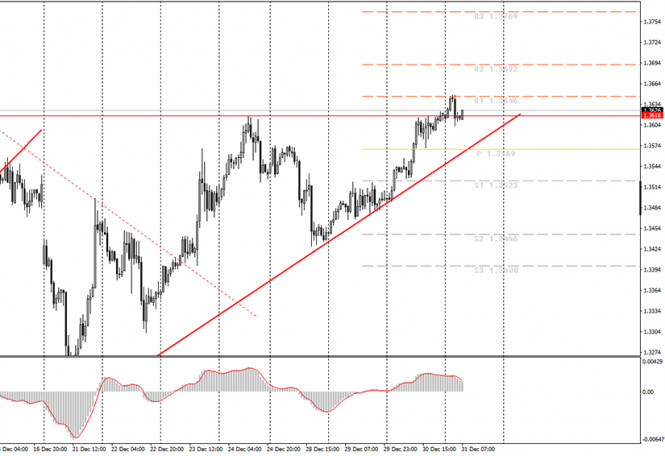
The GBP/USD pair continued to steadily increase during Thursday night trading, which is happening recently in general. But despite the fact that it is moving upwards during yesterday's evening and today's night trading, the MACD indicator began to decline. This is called "discharge", when the direction of price and indicator movement does not coincide. Therefore, the last strong signal was formed at midnight on December 30. You can literally earn 20 points from it, if you close the deal on the MACD indicator downward reversal in just a couple of hours. The beginners who slept through this moment could earn more. At the same time, if someone wants to open new positions on December 31, it is necessary to wait for the pound's quote to decline to the trend line. In any case, either in order for the MACD to discharge to the zero level and form a strong signal, or in order to break through this trend line. In general, the price of the pound sterling, just like the euro, also continues to rise on New Year's eve. However, there are still no special growth factors. Strange enough, today's macroeconomic economic calendar even includes one macroeconomic report on applications for US unemployment benefits. However, it is unlikely that anyone will pay attention to it at all, but it will help to form a certain idea about the unemployment rate. Recently, this indicator has tended to increase, although the official unemployment rate has been declining all this time. There is no other more important news. Yesterday, Boris Johnson and Ursula von der Leyen signed a trade deal that will take effect tomorrow when the UK officially leaves the EU. However, this event cannot be called important for the currency market. These are just signatures, and so it was clear that a deal was reached, agreed and would be approved and signed. In view of this, the pound sterling has been growing almost continuously during the past few months, so the signatures just don't matter. It can also be noted that the British Parliament approved a bill describing a trade agreement with the European Union. However, no one expected that the Parliament would block this agreement on December 30 and thus turn the nine-month negotiations and the deal to disappear. Possible scenarios on December 31: 1) It is important to buy orders at this time, since the upward trend line supports the trend again. Therefore, if you are willing to, it is possible to continue trading up with targets at 1.3666 and 1.3711 today. However, it is not suggested for the beginners to wait for the formation of a strong buy signal in the form of a price rebound from the trend line or an upward reversal of the MACD indicator near the zero level. 2) Selling seems to be inappropriate at the moment, as the price is above the upward trend line. Thus, you should wait for the price to consolidate below the trend line in order to consider sales. The support levels of 1.3534 and 1.3447 are the targets for short positions. What's on the chart? - Support and Resistance Price Levels are levels that act as targets when buying or selling. You can place Take-Profit near these levels.
- Red lines are the channels or trend lines that display the current trend and show in which direction it is better to trade now.
- Up/down arrows show where you should sell or buy after reaching or breaking through particular levels.
- The MACD indicator consists of a histogram and a signal line. When they cross, this is a signal to enter the market. It is recommended to use this indicator in combination with trend lines (channels and trend lines).
Important announcements and economic reports that you can always find in the news calendar can greatly influence the trajectory of a currency pair. Therefore, at the time of their release, we recommended to trade as carefully as possible or exit the market in order to avoid a sharp price reversal. Beginners in the currency market should remember that not every single trade has to be profitable. The development of a clear strategy and money management are the key for a successful trading over a long period of time. Indicator analysis. Daily review for the GBP/USD pair on 12/31/20 2020-12-31 Trend analysis (Fig. 1) Today, the price from the level of 1.3620 (closing of yesterday's daily candle) will try to move upwards to the target of 1.3677 – the pullback level of 76.4% (yellow dotted line). After testing this line, the upward movement may continue to the next target of 1.3943 – the pullback level of 85.4% (yellow dotted line). 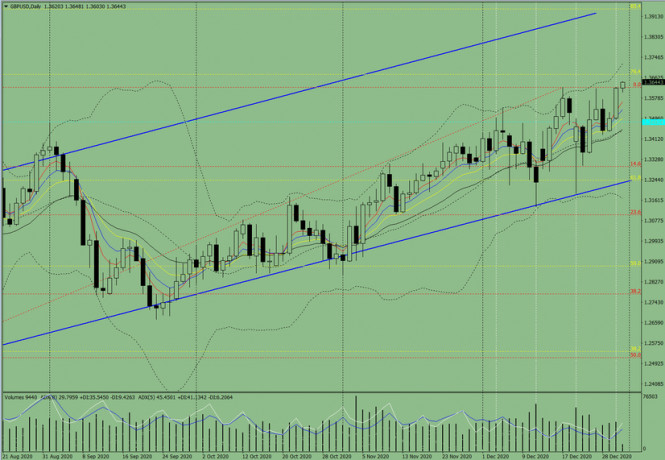
Figure 1 (daily chart). Comprehensive analysis: - Indicator analysis - up
- Fibonacci levels - up
- Volumes - up
- Candlestick analysis - up
- Trend analysis - up
- Bollinger lines - up
- Weekly chart - up
Overall conclusion: Today, the price from the level of 1.3620 (closing of yesterday's daily candle) will most likely continue rising towards the target of 1.3677 – the pullback level of 76.4% (yellow dotted line). Upon testing this line, the upward movement may continue to the next target of 1.3943 – the pullback level of 85.4% (yellow dotted line). An alternative scenario: the price from the level of 1.3620 (closing of yesterday's daily candle) may continue to move upwards to the target of 1.3677 – the pullback level of 76.4% (yellow dotted line). After testing this line, a downward pullback is possible, with the target of 1.3481 – the historical support level (blue dashed line). GBP/USD. December 31. COT report. The British Parliament has approved a trade agreement with the European Union. The deal is officially signed 2020-12-31 GBP/USD – 1H. 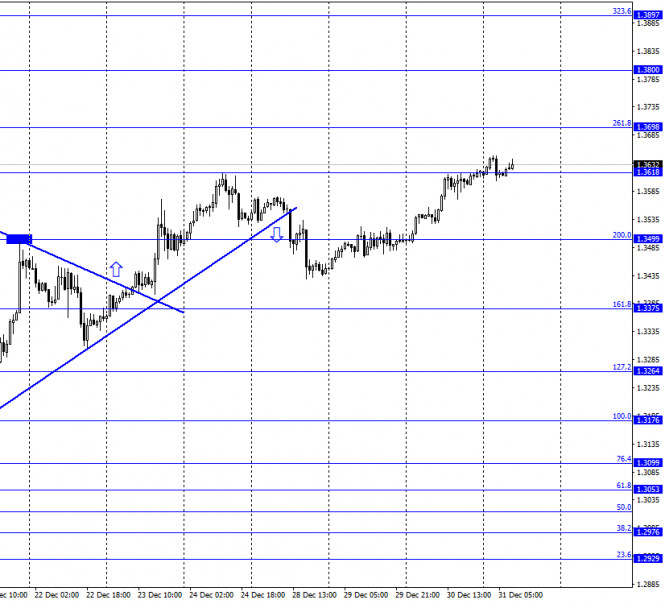
According to the hourly chart, the GBP/USD pair continued the growth process on December 30 and closed above the level of 1.3618. Thus, the growth process can now be continued in the direction of the next corrective level of 261.8% (1.3698). Bull traders are once again in a state of euphoria. Brexit is finally over. The UK Parliament voted for the trade deal bill yesterday and passed it almost unanimously. 521 deputies are in favor of the deal and only 73 of them are against it. Boris Johnson himself and European Commission President Ursula von der Leyen signed a trade agreement remotely yesterday. "Brexit is not the end, but the beginning of something new. Now we have a great responsibility: to make the best use of the power and the tools that we have once again got on our hands," Boris Johnson said. Thus, the Brexit saga can officially be considered complete. Traders will now be keeping a close eye on how Boris Johnson will "lift the UK off its knees". Many analysts are very skeptical about this. Britain may benefit from its independence in the long run, but economists expect more cuts in the British economy in the coming quarters. Even though a free trade agreement has been concluded. GBP/USD – 4H. 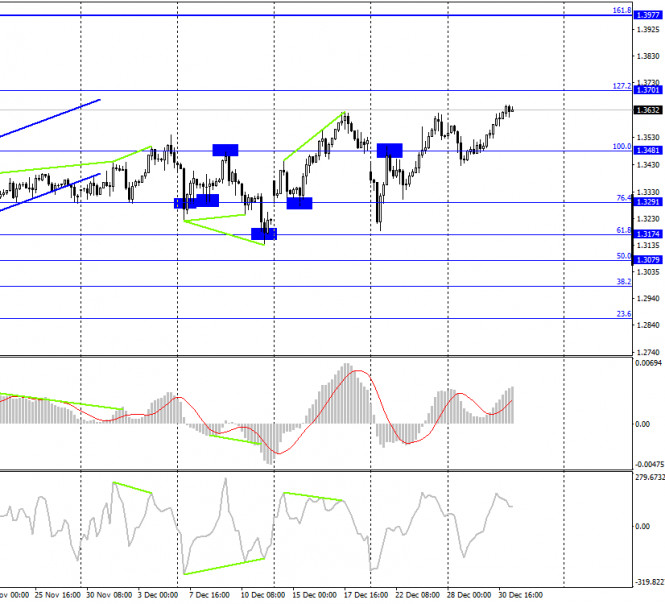
On the 4-hour chart, the GBP/USD pair performed a reversal in favor of the British currency and continued the growth process in the direction of the corrective level of 127.2% (1.3701). The rebound of quotes from this Fibo level will work in favor of the US currency and the beginning of the fall in the direction of the corrective level of 100.0% (1.3481). Fixing the pair's rate above the level of 127.2% will increase the probability of further growth in the direction of the next corrective level of 161.8% (1.3977). GBP/USD – Daily. 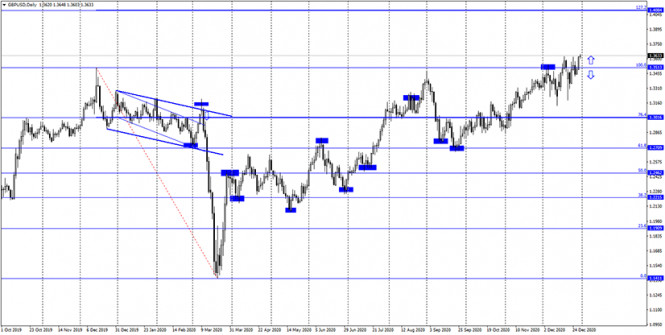
On the daily chart, the pair's quotes performed a consolidation above the corrective level of 100.0% (1.3513). Thus, the growth process can be continued in the direction of the next Fibo level of 127.2% (1.4084). GBP/USD – Weekly. 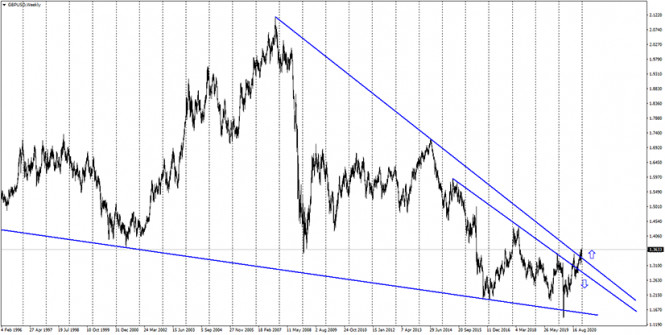
On the weekly chart, the pound/dollar pair performed an increase to the second downward trend line. A rebound from it in the long term will mean a reversal in favor of the US dollar and a long fall in the British dollar's quotes. Overview of fundamentals: There were no economic reports or other developments in the UK and the US on Wednesday. The information background was completely absent. Except for the pompous news regarding the signing of a trade deal. The economic calendar for the US and the UK: US - number of initial and repeated applications for unemployment benefits (13:30 GMT). On December 31, the calendar of economic events in the UK and the US are almost empty. The information background will be absent today. COT (Commitments of Traders) report: 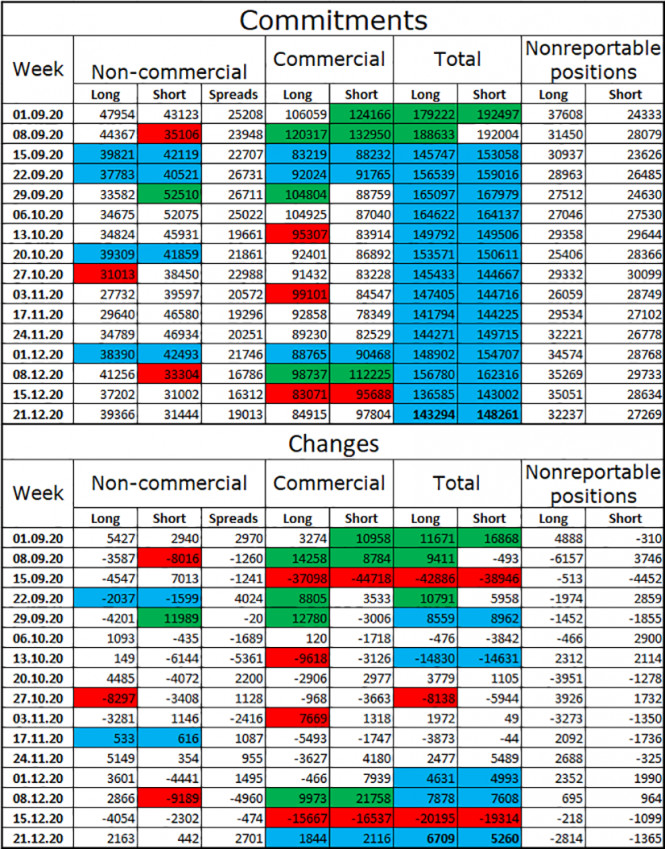
The latest COT report showed that speculators were getting rid of both long and short contracts. The new COT report, which was released only last night, showed only small changes in the mood of major traders. The "Non-commercial" category of traders opened in the reporting week until December 21 - 2,000 new long contracts and 500 short contracts. Such figures do not allow us to draw any serious conclusions about the future of the British pound. It can be noted that speculators again increased purchases of the British, but this was already 8 days ago. The total number of long contracts focused on the hands of speculators is only 8,000 more than short contracts. For example, the difference in the euro currency is 3 times. Thus, I still can not conclude that the mood for the British is exclusively "bullish" and that the pound will continue to grow. GBP/USD forecast and recommendations for traders: It was recommended to open new purchases of the British dollar in case of consolidation above the level of 1.3618 on the hourly chart with targets of 1.3698 and 1.3800. I recommend selling the pound at a rebound from the corrective level of 127.2% on the 4-hour chart with targets of 1.3618 and 1.3499. Terms: "Non-commercial" - major market players: banks, hedge funds, investment funds, private, large investors. "Commercial" - commercial enterprises, firms, banks, corporations, companies that buy currency, not for speculative profit, but to ensure current activities or export-import operations. "Non-reportable positions" - small traders who do not have a significant impact on the price.
Author's today's articles: Oscar Ton  Sebastian Seliga  Sebastian Seliga was born on 13th Oсtober 1978 in Poland. He graduated in 2005 with MA in Social Psychology. He has worked for leading financial companies in Poland where he actively traded on NYSE, AMEX and NASDAQ exchanges. Sebastian started Forex trading in 2009 and mastered Elliott Wave Principle approach to the markets by developing and implementing his own trading strategies of Forex analysis. Since 2012, he has been writing analitical reviews based on EWP for blogs and for Forex websites and forums. He has developed several on-line projects devoted to Forex trading and investments. He is interested in slow cooking, stand-up comedy, guitar playing, reading and swimming. "Every battle is won before it is ever fought", Sun Tzu Sebastian Seliga was born on 13th Oсtober 1978 in Poland. He graduated in 2005 with MA in Social Psychology. He has worked for leading financial companies in Poland where he actively traded on NYSE, AMEX and NASDAQ exchanges. Sebastian started Forex trading in 2009 and mastered Elliott Wave Principle approach to the markets by developing and implementing his own trading strategies of Forex analysis. Since 2012, he has been writing analitical reviews based on EWP for blogs and for Forex websites and forums. He has developed several on-line projects devoted to Forex trading and investments. He is interested in slow cooking, stand-up comedy, guitar playing, reading and swimming. "Every battle is won before it is ever fought", Sun Tzu Stanislav Polyanskiy  Graduated from Odessa State Economic University. On Forex since 2006. Writes analytical reviews about international financial markets for more than 3 years. Worked as a currency analyst in different finance companies for a long time including the biggest companies of Russia and Ukraine. Graduated from Odessa State Economic University. On Forex since 2006. Writes analytical reviews about international financial markets for more than 3 years. Worked as a currency analyst in different finance companies for a long time including the biggest companies of Russia and Ukraine. Sergey Belyaev  Born December 1, 1955. In 1993 graduated from Air Force Engineering Academy. In September 1999 started to study Forex markets. Since 2002 has been reading lectures on the technical analysis . Is fond of research work. Created a personal trading system based on the indicator analysis. Authored the book on technical analysis "Calculation of the next candlestick". At present the next book is being prepared for publishing "Indicator Analysis of Forex Market. Trading System Encyclopedia". Has created eleven courses on indicator analysis. Uses classical indicators. Works as a public lecturer. Held numerous seminars and workshops presented at international exhibitions of financial markets industry. Is known as one of the best specialists in the Russian Federation researching indicator analysis. Born December 1, 1955. In 1993 graduated from Air Force Engineering Academy. In September 1999 started to study Forex markets. Since 2002 has been reading lectures on the technical analysis . Is fond of research work. Created a personal trading system based on the indicator analysis. Authored the book on technical analysis "Calculation of the next candlestick". At present the next book is being prepared for publishing "Indicator Analysis of Forex Market. Trading System Encyclopedia". Has created eleven courses on indicator analysis. Uses classical indicators. Works as a public lecturer. Held numerous seminars and workshops presented at international exhibitions of financial markets industry. Is known as one of the best specialists in the Russian Federation researching indicator analysis. Grigory Sokolov  Born 1 January, 1986. In 2008 graduated from Kiev Institute of Business and Technology with "Finance and Credit" as a major. Since 2008 has studied the behavior of various currency pairs and their correlation on Forex. In his works and trading practice he uses candlestick analysis and Fibonacci technique. Since 2009 has written analytical reviews and articles which are published on popular Internet resources. Interests: music, computers and cookery. "Out of five deadly sins of business and as a rule, the most widespread, excessive striving to get profit is the worst". P. Drucker Born 1 January, 1986. In 2008 graduated from Kiev Institute of Business and Technology with "Finance and Credit" as a major. Since 2008 has studied the behavior of various currency pairs and their correlation on Forex. In his works and trading practice he uses candlestick analysis and Fibonacci technique. Since 2009 has written analytical reviews and articles which are published on popular Internet resources. Interests: music, computers and cookery. "Out of five deadly sins of business and as a rule, the most widespread, excessive striving to get profit is the worst". P. Drucker
Subscription's options management Theme's:
Fundamental analysis, Fractal analysis, Wave analysis, Technical analysis, Stock Markets
Author's :
A Zotova, Aleksey Almazov, Alexander Dneprovskiy, Alexandr Davidov, Alexandros Yfantis, Andrey Shevchenko, Arief Makmur, Dean Leo, Evgeny Klimov, Fedor Pavlov, Grigory Sokolov, I Belozerov, Igor Kovalyov, Irina Manzenko, Ivan Aleksandrov, l Kolesnikova, Maxim Magdalinin, Mihail Makarov, Mohamed Samy, Mourad El Keddani, Oleg Khmelevskiy, Oscar Ton, Pavel Vlasov, Petar Jacimovic, R Agafonov, S Doronina, Sebastian Seliga, Sergey Belyaev, Sergey Mityukov, Stanislav Polyanskiy, T Strelkova, Torben Melsted, V Isakov, Viktor Vasilevsky, Vladislav Tukhmenev, Vyacheslav Ognev, Yuriy Zaycev, Zhizhko Nadezhda
Edit data of subscription settings
Unsubscribe from the mailing list Sincerely,
Analysts Service | If you have any questions, you can make a phone call using one of the
InstaForex Toll free numbers right now:
|  | InstaForex Group is an international brand providing online trading services to the clients all over the world. InstaForex Group members include regulated companies in Europe, Russia and British Virgin Islands. This letter may contain personal information for access to your InstaForex trading account, so for the purpose of safety it is recommended to delete this data from the history. If you have received this letter by mistake, please contact InstaForex Customer Relations Department. |


No comments:
Post a Comment