| Analytics and trading signals for beginners. How to trade EUR/USD on December 18? Analysis of Thursday deals. Getting ready for Friday 2020-12-18 Hourly chart of the EUR/USD pair 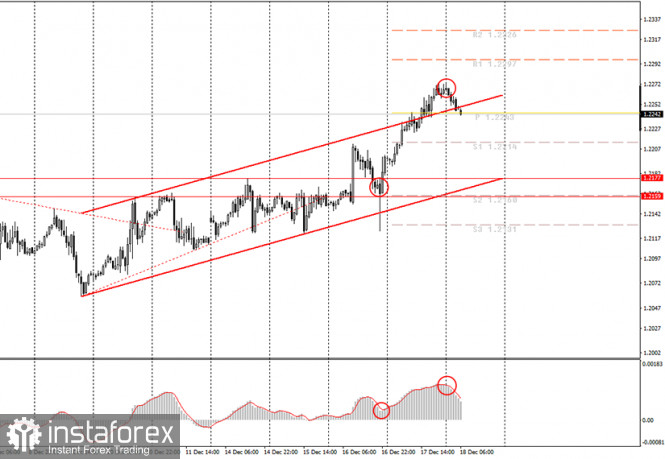
Yesterday, the EUR/USD pair continued to trade in exactly the same way it did at the beginning of the week. That is, it continued its upward movement. We have already repeatedly raised the question of why the euro is rising (and with it the pound), or rather, why is the dollar falling? We have repeatedly tried to understand this issue, but the most likely answer can only be speculative growth. Simply put, the euro grows simply because it is being bought, and the dollar is getting cheaper simply because it is being sold. Traders are not paying attention to fundamental news or macroeconomic reports right now. They just buy pounds and euros. This results in both currencies being overbought and also inflates a bubble (oil rising to $140 per barrel). Sooner or later, the bubble will burst. But at the same time, it can inflate as much as necessary. The last signal, which was at the disposal of novice traders - a buy signal, is encircled in the first circle. It was possible to keep it open up to the 1.2267 level, where the MACD has already turned down. The rising channel kept the upward trend in action, so the trade should have been bullish. Even if novice traders left open deals near target levels, it is still good, since there is profit. The European Union published its inflation report for November. As analysts expected, the consumer price index remained unchanged in annual terms -0.3% and slowed down to -0.3% in monthly terms. And so one of the most important indicators of the state of any economy in the EU is negative and this is bad (yes, oddly enough, negative inflation is bad for the economy). However, the euro did not pay any attention to this report. Meanwhile, the US released a report on initial claims for unemployment benefits, which has been growing for several consecutive days, warning of a possible increase in the unemployment rate. Their total number was 885,000. The number of repeated ones continues to fall - 5.5 million. There are no major releases scheduled for today in the EU and the US. However, markets continue to virtually ignore all macroeconomic data anyway, so what's the difference? We do not even have any important topics that could create a background for the dollar and the euro. The US is discussing a package of new stimulus measures in Congress, but what is the point of talking about it now if it has been discussed back in August? Possible scenarios for December 18: 1) Long positions are still relevant at the moment, as an upward trend is visible. However, at the moment, the pair has begun to correct, so you need to wait until the correction has ended, the MACD indicator will discharge to the zero level and only after that should you wait for a new buy signal if the price remains inside the upward channel. 2) Trading for a fall looks absolutely inappropriate now, since the upward trend is clearly visible. Thus, sellers need to wait for either the upward trend to end, or a downward trend to appear, and only then should you consider the possibilities of opening short deals. The most likely signal will be when the price settles below the current rising channel. On the chart: Support and Resistance Levels are the Levels that serve as targets when buying or selling the pair. You can place Take Profit near these levels. Red lines are the channels or trend lines that display the current trend and show in which direction it is better to trade now. Up/down arrows show where you should sell or buy after reaching or breaking through particular levels. The MACD indicator (14,22,3) consists of a histogram and a signal line. When they cross, this is a signal to enter the market. It is recommended to use this indicator in combination with trend lines (channels and trend lines). Important announcements and economic reports that you can always find in the news calendar can seriously influence the trajectory of a currency pair. Therefore, at the time of their release, we recommended trading as carefully as possible or exit the market in order to avoid a sharp price reversal. Beginners on Forex should remember that not every single trade has to be profitable. The development of a clear strategy and money management are the key to success in trading over a long period of time. Analytics and trading signals for beginners. How to trade GBP/USD on December 18? Analysis of Thursday deals. Getting ready for Friday 2020-12-18 Hourly chart of the GBP/USD pair 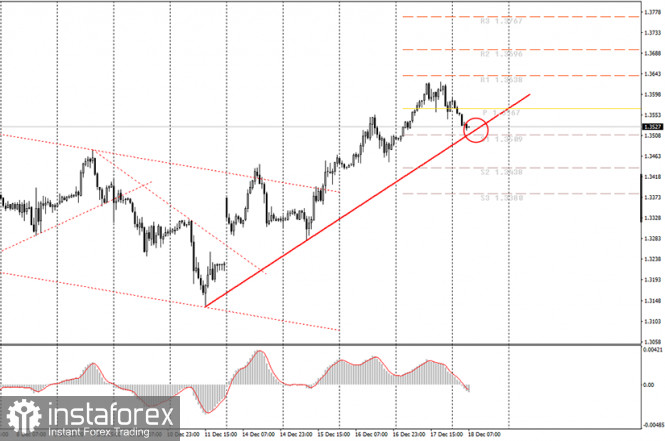
The GBP/USD pair also continued to move up throughout the week, and it is very difficult to find an explanation for it. Yes, on the one hand, we can say that traders still believe that London and Brussels will be able to conclude a trade deal, but the pound cannot rise in price on this expectation alone and for several months? But this is exactly how it turns out. Negotiations are constantly being extended, there is no progress, the parties are constantly announcing "serious disagreements", suggesting to prepare for a hard Brexit, but traders still believe in the deal and buy the pound. Thus, we believe that the pound's growth is as speculative as the euro. And that's it. From a technical point of view, the upward trend line is still present and will do so. However, the price is currently correcting, therefore, in the near future, either the price will rebound off the trend line or it will overcome it. In the first case, beginners will receive a new buy signal, in the second - a sell signal. Therefore, the only thing to do is to wait a little and hope that the signal will not be false. The pound continues to rise no matter what. We have been talking about this for several weeks or even months. Nevertheless, nothing changes from our bewilderment. Yesterday, the results of the Bank of England's final meeting for 2020 were summed up, and no important decisions were made. The key rate remained at the "ultra-low" level of 0.1%, and the asset repurchase program remained at 895 billion pounds. And so the Bank of England did not lower the rate and did not give any hints as to when it might take this step. Recall that the rate cut is a strong bearish factor for any currency (in our case, the pound) and the Bank of England has been considering the possibility of using this instrument to stimulate the economy for six months. But, as we can see, everyone is hesitant to introduce it or is just waiting for it to become thoroughly known about Brexit and the presence/absence of a deal between the UK and the European Union. The UK is set to release reports on consumer confidence and retail sales for November. However, we are almost certain that traders will not react to any of these data. They are already unhappy with the current news, and we can not guarantee that the most important reports will be ignored. Therefore, technique, that is, technical signals, will be prioritized. On Friday, traders often like to lock in part of the profit on trending deals, so there is a possibility that the downward movement will continue, but the trend line must be overcome. Possible scenarios for December 18: 1) The upward trend is still maintained, as evidenced by the fact that the price is above the trend line. So now novice traders are advised to expect that the price would rebound from the trend line and/or an upward reversal of the MACD indicator. In this case, you are advised to open new long positions while aiming for the resistance levels of 1.3638 and 1.3696. 2) Selling, from our point of view, is not advisable right now, since there is an upward trend line. Therefore, sellers need to wait until the price overcomes this line and only after that should they start trading down while aiming for 1.3438 and 1.3380 (which, however, may happen in the next few hours). On the chart: Support and Resistance Levels are the Levels that serve as targets when buying or selling the pair. You can place Take Profit near these levels. Red lines are the channels or trend lines that display the current trend and show in which direction it is better to trade now. Up/down arrows show where you should sell or buy after reaching or breaking through particular levels. The MACD indicator consists of a histogram and a signal line. When they cross, this is a signal to enter the market. It is recommended to use this indicator in combination with trend lines (channels and trend lines). Important announcements and economic reports that you can always find in the news calendar can seriously influence the trajectory of a currency pair. Therefore, at the time of their release, we recommended trading as carefully as possible or exit the market in order to avoid a sharp price reversal. Beginners on Forex should remember that not every single trade has to be profitable. The development of a clear strategy and money management are the key to success in trading over a long period of time. Simplified wave analysis and forecast for GBP/USD, USD/JPY, USD/CHF on December 18 2020-12-18 GBP/USD Analysis: Quotes of the British pound continue to move to the north of the price chart. The price is approaching the lower limit of the preliminary target zone. The last section in the direction of the trend counts down from December 7. In the structure of this wave, an intermediate correction is nearing completion. Forecast: Today, the current decline is expected to end, the formation of a reversal and the beginning of a price rise. The change of course may coincide with the release of important news blocks. A breakout of the upper limit of the nearest resistance may occur today. Potential reversal zones Resistance: - 1.3670/1.3700 - 1.3590/1.3620 Support: - 1.3500/1.3470 Recommendations: There are no conditions for selling the pound on the market today. It is recommended to track signals for buying the instrument in the area of settlement support. 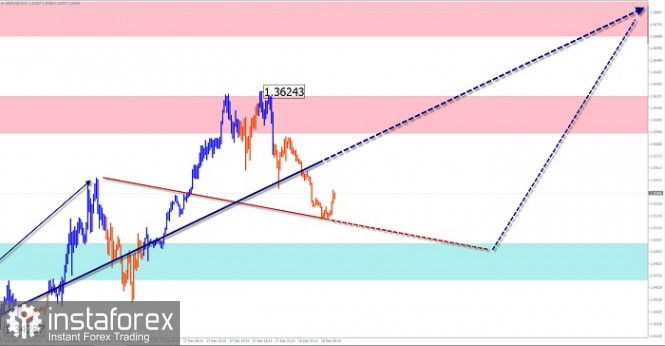
USD/JPY Analysis: For most of this year, the Japanese yen has been strengthening against the US dollar. The last section in the direction of the trend counts down from November 9. The wave structure looks complete. The price is approaching the upper limit of a strong potential reversal zone. Forecast: At the next trading session, there is a high probability of a price rise, no further than the calculated resistance zone. Then it is expected to form a reversal and move the price down, up to the levels of settlement support. Potential reversal zones Resistance: - 103.50/103.80 Support: - 102.80/102.50 Recommendations: Buying the yen today can be unprofitable. It is recommended to pay all attention to the search for signals of selling the pair. 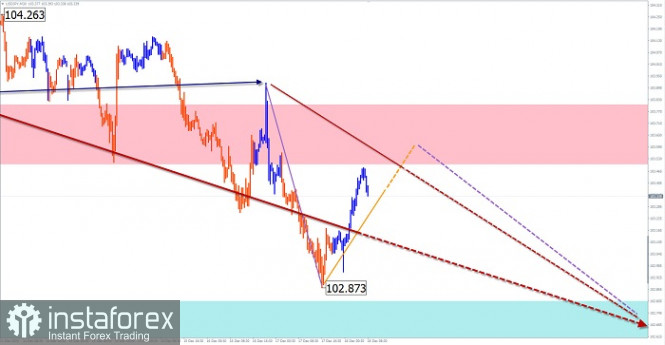
USD/CHF Analysis: The trend of the Swiss franc major is directed to the south of the chart. The unfinished section started on November 11. It recently completed a hidden correction. Since last week, a reversal pattern has been developing on the chart to continue the main trend. Forecast: In the first half of the current day, there is a high probability of a flat movement mood, with an upward vector. In the area of the resistance zone, a change in the rate is expected, followed by a decline. At the end of the day, you can expect an increase in the volatility of the pair. Potential reversal zones Resistance: - 0.8860/0.8890 Support: - 0.8790/0.8760 Recommendations: Franc purchases are unpromising today. After the appearance of reversal signals in the area of the resistance zone, it is recommended to take short positions. 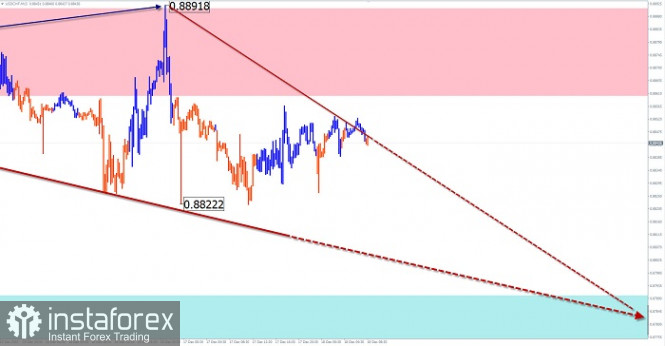
Explanation: In the simplified wave analysis (UVA), waves consist of 3 parts (A-B-C). The last incomplete wave is analyzed. The solid background of the arrows shows the formed structure, and the dotted one shows the expected movements. Attention: The wave algorithm does not take into account the duration of the instrument's movements in time! Indicator analysis. Daily review on the EUR/USD currency pair for December 18, 2020 2020-12-18 Trend analysis (Figure 1). Today, the market from the level of 1.2267 (closing of yesterday's daily candlestick) will try to start moving down with the target of 1.2177 support level (blue bold line). If this level is tested, it is possible to continue working up to the target of 1.2275 – a pullback level of 85.4% (yellow dotted line). 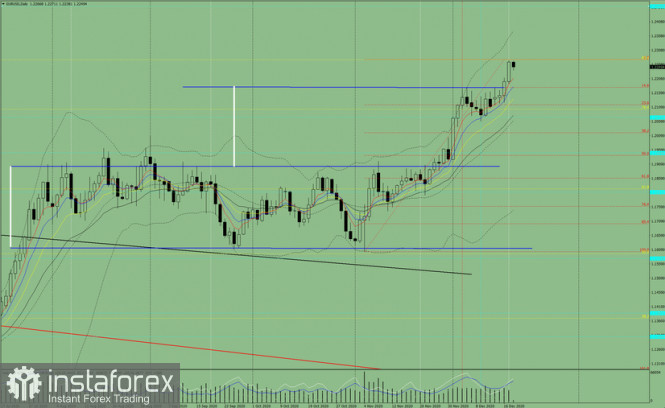
Figure 1 (Daily Chart). Comprehensive analysis: - Indicator analysis - down
- Fibonacci levels - down
- Volumes - down
- Candlestick analysis - down
- Trend analysis - down
- Bollinger bands - up
- Weekly chart - down
General conclusion: Today, the price from the level of 1.2267 (closing of yesterday's daily candlestick) will try to start moving down with the target of 1.2177 support level (blue bold line). If this level is tested, it is possible to continue working up to the target of 1.2275 – a pullback level of 85.4% (yellow dotted line). Alternative scenario: when moving upward and testing the pullback level of 85.4%, 1.2275 (yellow dotted line), it is possible to work up with the target of 1.2462 - the historical resistance level (blue dotted line). Elliott wave analysis of EUR/USD for December 18, 2020 2020-12-18 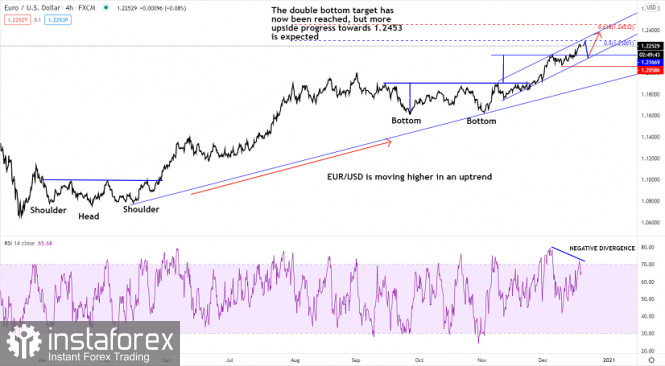
We have been following EUR/USD as an educational lesson through many weeks now. During this time, we have been focused towards the upside and we still are mainly focused towards the upside, but we are beginning to see clear weakness in the ongoing uptrend. The pivot point separating the uptrend from starting a more prolonged correction is seen at 1.2058 a break below this support will confirm the completion of the uptrend and the start of a correction towards 1.1610. That said, we also need to keep our focused locked towards the upside as long as key-support at 1.2058 remains untouched. We are currently looking for resistance near 1.2300, which is likely to ignite a small correction 1.2130 and maybe slightly below before the final attach higher towards our target at 1.2453 to complete the ongoing uptrend since the 1.0623 low. Remember that the trend and paitinece are your friends Technical Analysis of EUR/USD for December 18, 2020 2020-12-18 Technical Market Outlook: The EUR/USD pair has broken above the ascending channel upper boundary line located around the level of 1.2151 and made a new swing high at the level of 1.2272 (at the time of writing the article). After the new high was made the pair has moved back inside of the short-term ascending channel during the pull-back, but the next target for bulls is seen at the level of 1.2411. The nearest technical support is seen at the level of 1.2211. The strong and positive momentum supports the short-term bullish outlook for Euro. The larger time frame trend remains up. Weekly Pivot Points: WR3 - 1.2281 WR2 - 1.2233 WR1 - 1.2171 Weekly Pivot - 1.2118 WS1 - 1.2069 WS2 - 1.2005 WS3 - 1.1960 Trading Recommendations: Since the middle of March 2020 the main trend is on EUR/USD pair has been up. This means any local corrections should be used to buy the dips until the key technical support is broken. The key long-term technical support is seen at the level of 1.1609. The key long-term technical resistance is seen at the level of 1.2555. 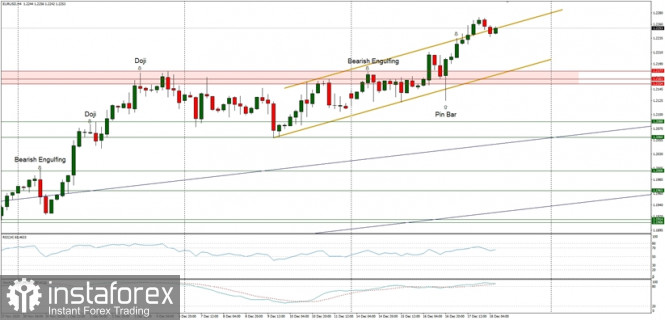
Elliott wave analysis of EUR/JPY for December 18, 2020 2020-12-18 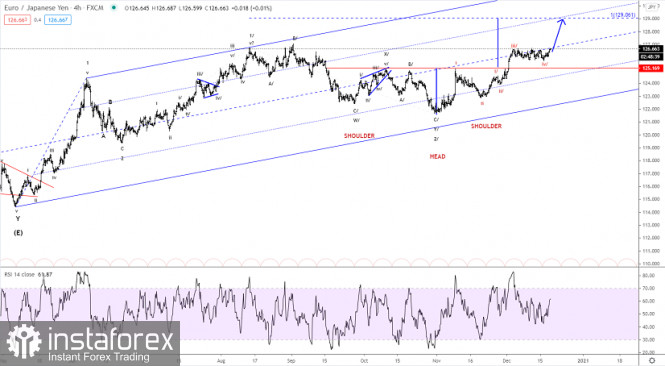
EUR/JPY finally looks to be ready to break above short-term key-resistance at 126.72 for a continuation higher towards 127.02 and ideally closer to the 129.06 target. Short-term we see support at 126.39 and solid support at 126.02, which we expect will be able to protect the downside for the expected break above 126.72 for the next push higher. R3: 127.27 R2: 127.30 R1: 126.78 Pivot: 126.39 S1: 126.02 S2: 125.71 S3: 125.50 We are long EUR from 126.25 with our stop placed at 125.70 Technical Analysis of GBP/USD for December 18, 2020 2020-12-18 Technical Market Outlook: The GBP/USD pair has made another swing high located at the level of 1.3620, but the rally was capped after the Bearish Engulfing pattern was made at the H4 time frame chart. The bulls are still in control of the market, the momentum is still strong and positive, but the market conditions are overbought, so it might be a time for a pull-back. The nearest technical support is seen at the level of 1.3538 and 1.3515. Please notice, the up trend at the daily time frame chart is still in progress and there is no indication of a trend change yet. Weekly Pivot Points: WR3 - 1.3813 WR2 - 1.3637 WR1 - 1.3455 Weekly Pivot - 1.3298 WS1 - 1.3125 WS2 - 1.2955 WS3 - 1.2786 Trading Recommendations: The GBP/USD pair might have started a long term up trend and the trigger for this trend was the breakout above the level or 1.3518 on the weekly time frame chart. All the local corrections should be used to enter a buy orders as long as the level of 1.2674 is not broken. The long-term target for bulls is seen at the level of 1.4370. 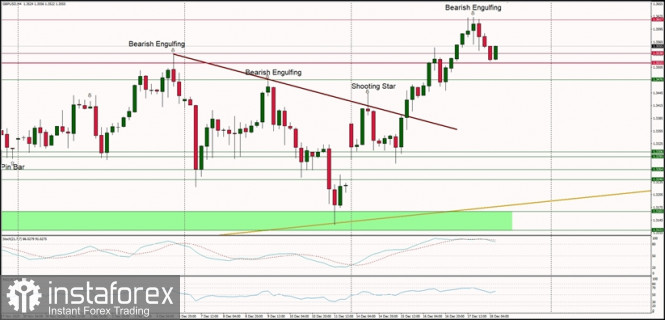
Indicator Analysis. Daily review for the GBP/USD currency pair 12/18/20 2020-12-18 Trend Analysis (figure 1). Today, the market will try to continue going down from the level of 1.3577 (closing of yesterday's daily candle) with the target of 1.3530 at the support line (red bold line). When this line is reached, the price can continue to go down with the target of 1.3421 - 13 average EMA (yellow thin line). 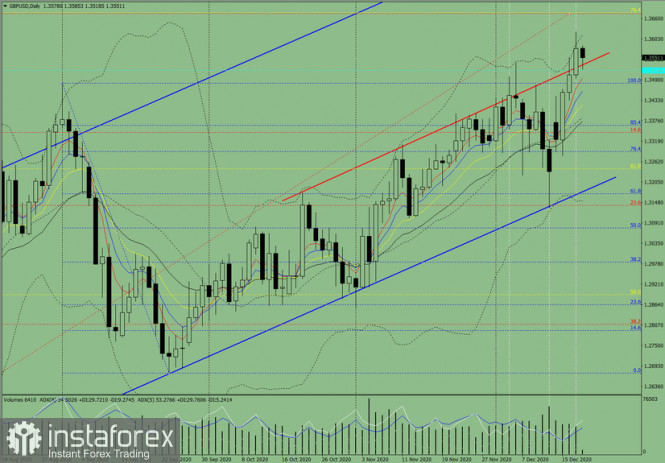
Figure 1 (daily chart). Comprehensive Analysis: - Indicator Analysis - down
- Technical Analysis - down
General Conclusion: Today, the price will try to continue going down from the level of 1.3577 (closing of yesterday's daily candle) with the target of 1.3530 at the support line (red bold line). When this line is reached, the price can continue to go down with the target of 1.3421 - 13 average EMA (yellow thin line). Alternative scenario: when going down and reaching the target of 1.3530 at the support line (red bold line), the price may start going up with the target of 1.3623 upper fractal (daily candle from 17.12.2020). When this level is reached, it will continue to go up to the target of 1.3677 at the rollback level of 76.4% (yellow dotted line). EUR/USD: plan for the European session on December 18. COT reports. Are euro buyers tired of fighting for the trend and decided to take a break? Bears aim for a rebound of 1.2226 2020-12-18 To open long positions on EUR/USD, you need: Data on the US labor market, which turned out to be worse than economists' expectations, caused the euro to rise in the afternoon and there was also an attempt to surpass the 1.2255 level, which has now turned into another resistance. However, take note that the signal to sell the euro, which appeared at the beginning of the US session, was quite good, the implementation just simply failed. Let's take a look at the 5-minute chart. I have highlighted the 1.2255 area, which I drew attention to in yesterday's review. You can see how the bulls made several unsuccessful attempts to consolidate higher, forming a false breakout there and a signal to sell the euro. However, the downward movement was around 17 points, and afterwards buyers hoped to break this range and the bull market continued. 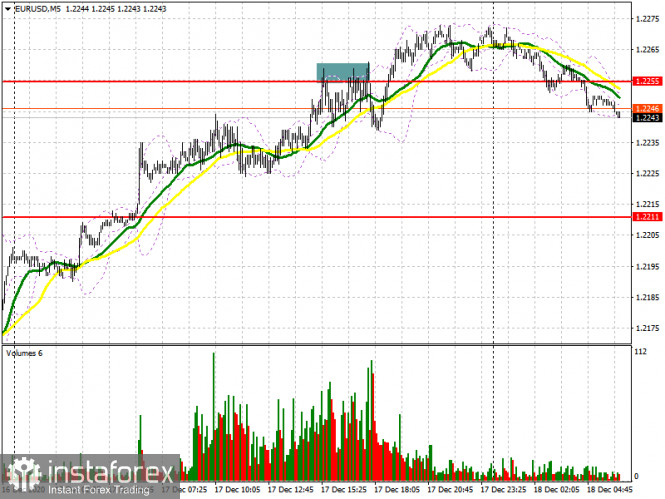
Today, buyers will be puzzled by protecting the support level of 1.2226 in the first half of the day, where the pair is now declining. Moving averages also pass there, playing on the side of buyers. The pair began to fall during the Asian session, and forming a false breakout in the 1.2226 area will help stop the bearish momentum, which will lead to producing a convenient entry point to long positions in order to sustain the upward trend and return to a new high of 1.2271. A breakout and being able to settle above this range, along with good reports on the indicator of business environment, the indicator for assessing the current situation and the indicator of economic expectations from IFO Germany, will open new highs for euro buyers in the areas of 1.2304 and 1.2339, where I recommend taking profit. If buyers are not active in the 1.2226 area, a breakdown of this level may take place. In this case, it is better not to rush to buy, but to wait until a larger low at 1.2181 has been updated, from where you can open long positions immediately on the rebound, counting on an upward correction of 20-25 points within the day. To open short positions on EUR/USD, you need: Euro sellers hope to regain control over the 1.2226 level. Getting the pair to settle below this range and testing it from the other side will increase the pressure on the pair, which produces a good entry point for short positions. In this case, the main target will be the 1.2181 area, where I recommend taking profit. It is highly doubtful to expect the euro to return to the support area of 1.2130 at the end of this week. If the bulls manage to protect support at 1.2226, and the data for Germany turns out to be better than the economists' forecasts, we can expect a bull market and EUR/USD may return to an annual high of 1.2271. I recommend opening short positions from there only after forming a false breakout. It is best to count on selling on a rebound only after levels 1.2304 and 1.2339 have been tested, counting on a downward correction of 15-20 points within the day. 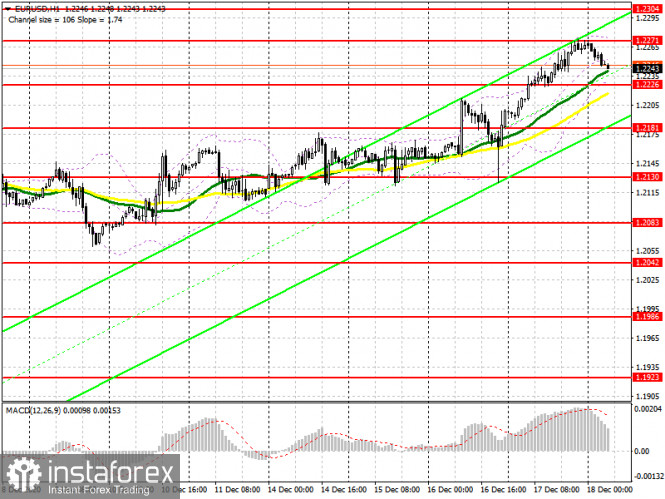
The Commitment of Traders (COT) report for December 8 recorded an increase in long positions and a reduction in short positions. Buyers of risky assets believe in sustaining the bull market and the euro's growth after surpassing the psychological mark in the area of the 20th figure. Thus, long non-commercial positions rose from 207,302 to 222,521, while short non-commercial positions fell from 67,407 to 66,092. The total non-commercial net position rose from 139,894 to 156,429 a week earlier. It is worth paying attention to the growth of the delta, observed for the third consecutive week, which completely negates the bearish trend observed at the beginning of this fall. We can only speak of a larger recovery after European leaders negotiate a new trade agreement with Britain. Indicator signals: Moving averages Trading is carried out slightly above 30 and 50 moving averages, which indicates an attempt by euro buyers to sustain the upward trend in the euro. Note: The period and prices of moving averages are considered by the author on the H1 hourly chart and differs from the general definition of the classic daily moving averages on the daily D1 chart. Bollinger Bands A breakout of the upper border of the indicator in the 1.2271 area will lead to a new upward movement for the euro. A breakout of the lower border of the indicator in the 1.2226 area will increase pressure on the pair and cause the euro to fall. Description of indicators - Moving average (moving average, determines the current trend by smoothing out volatility and noise). Period 50. It is marked in yellow on the chart.
- Moving average (moving average, determines the current trend by smoothing out volatility and noise). Period 30. It is marked in green on the chart.
- MACD indicator (Moving Average Convergence/Divergence — convergence/divergence of moving averages) Quick EMA period 12. Slow EMA period to 26. SMA period 9
- Bollinger Bands (Bollinger Bands). Period 20
- Non-commercial speculative traders, such as individual traders, hedge funds, and large institutions that use the futures market for speculative purposes and meet certain requirements.
- Long non-commercial positions represent the total long open position of non-commercial traders.
- Short non-commercial positions represent the total short open position of non-commercial traders.
- Total non-commercial net position is the difference between short and long positions of non-commercial traders.
GBP/USD: plan for the European session on December 18. COT reports. Pound losing ground, as Brexit rumors turn out to be just rumors 2020-12-18 To open long positions on GBP/USD, you need: Long deals on the pound in the first half of the day brought quite a lot of profit. The US session was more difficult. Let's take a look at the 5-minute chart and analyze all the entry points. In yesterday's forecast, I paid close attention to the 1.3550 level and advised you to open long positions from it. The chart clearly shows how the bulls surpassed 1.3550 and settled at this level, trading it from the other side. After that, GBP/USD grew, which made it possible to take more than 50 points of profit from the market. And in the afternoon, buyers were trying to pick up resistance at 1.3605, testing it from top to bottom, producing an entry point into long positions. But it did not rise, and the pair returned to the area below 1.3605. Sellers start to be active here. Updating the 1.3605 level, from the bottom up, produces an entry into short positions, afterwards the pair dropped more than 40 points. By the end of the day, the bulls returned the pound to 1.3605 and tried to gain a foothold there, but this led to another failure and a decline in the GBP/USD pair. 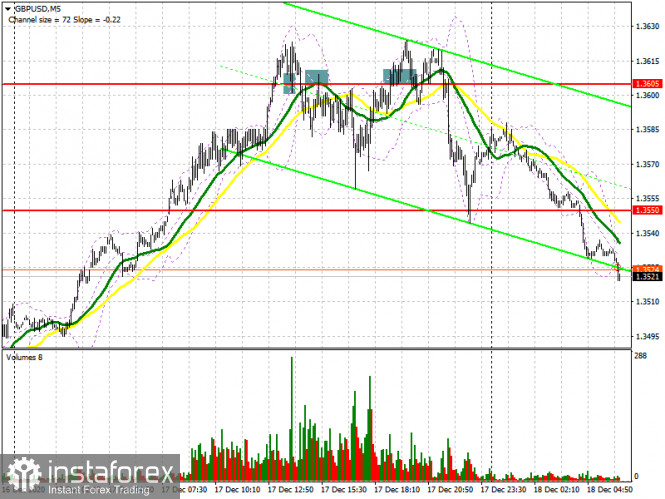
All the support and resistance levels have been revised. Let's build on new guidelines. In the first half of the day, the main task of buyers will be to surpass and get the pair to settle above resistance at 1.3539. A downward test of this level produces a good signal to open new long positions in sustaining the pound's growth, which will allow the pair to return to monthly highs in the 1.3617 area. The bull market will depend on whether buyers manage to gain a foothold above this range. Surpassing 1.3617 would open a straight path to the 1.3690 and 1.3750 highs. But such a scenario will only be possible if there is real information that a Brexit trade deal can actually be concluded in the near future. Any unexpected negative statements in this regard could cause the pound to sharply fall. Therefore, if GBP/USD is still under pressure, I recommend taking a closer look at long deals from the 1.3448 level, provided a false breakout is formed there. It is possible to buy GBP/USD immediately on a rebound from the low of 1.3362, counting on a correction of 20-30 points within the day. To open short positions on GBP/USD, you need: The bears are trying to regain control of the market and have cooled off the ardor of buyers at the end of Thursday. Pound sellers currently need a false breakout in the resistance area of 1.3539, which will confirm their intentions for a succeeding downward correction. In this scenario, there will be an opportunity for GBP/USD to fall to the 1.3448 low, where the bear market will first stop. Weak UK retail sales data will help sellers get to this level. The next target will be the 1.3362 area, but it will be available only when there is news that the parties are very far from signing a trade deal on Brexit. If we do not observe active sales from the 1.3539 level in the first half of the day, it is better not to go against the trend, but wait for an update of resistance at 1.3617, from where the pound can be sold, but only if a false breakout is formed there. Larger resistance levels, from which the pair can be sold immediately on a rebound, are seen in the areas of 1.3648 and 1.3698. 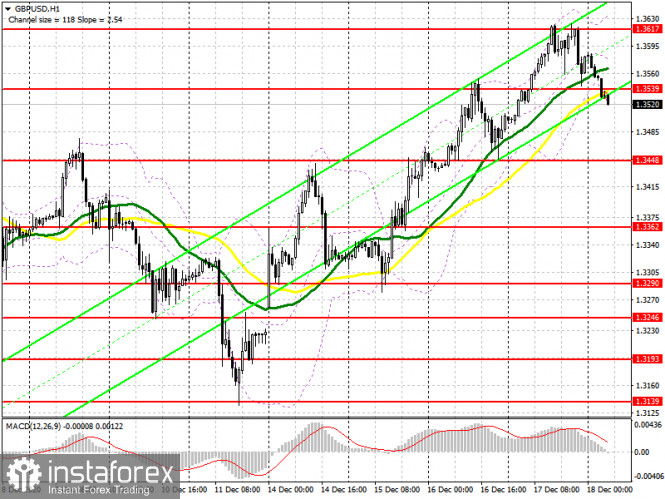
The Commitment of Traders (COT) reports for December 8 notes significant interest in the British pound. Long non-commercial positions rose from 37,087 to 39,344. At the same time, short non-commercial positions decreased from 44,986 to 33,634. As a result, the non-commercial net position became positive and jumped to 5,710 against a negative value of -7,899 a week earlier. All this suggests that traders are ready to bet on the pound's succeeding growth at the beginning of 2021 and on the buyers' advantage in the current situation even when there is no trade deal at the moment, and take note that there is just around two weeks left until the end of the year. Indicator signals: Moving averages Trading is carried out in the area of 30 and 50 moving averages, which indicates the bears' attempt to seize the initiative. Note: The period and prices of moving averages are considered by the author on the H1 hourly chart and differs from the general definition of the classic daily moving averages on the daily D1 chart. Bollinger Bands If the pound rises, the upper border of the indicator at 1.3620 will act as a resistance. A breakout of the lower border of the indicator in the 1.3520 area will increase the pressure on the pair. Description of indicators - Moving average (moving average, determines the current trend by smoothing out volatility and noise). Period 50. It is marked in yellow on the chart.
- Moving average (moving average, determines the current trend by smoothing out volatility and noise). Period 30. It is marked in green on the chart.
- MACD indicator (Moving Average Convergence/Divergence — convergence/divergence of moving averages) Quick EMA period 12. Slow EMA period to 26. SMA period 9
- Bollinger Bands (Bollinger Bands). Period 20
- Non-commercial speculative traders, such as individual traders, hedge funds, and large institutions that use the futures market for speculative purposes and meet certain requirements.
- Long non-commercial positions represent the total long open position of non-commercial traders.
- Short non-commercial positions represent the total short open position of non-commercial traders.
- Total non-commercial net position is the difference between short and long positions of non-commercial traders.
Prices of gold accelerated 2020-12-18  The prices of gold reached a six-week record today. Analysts believe that Fed's easing of monetary policy and introduction of additional stimulus measures from the US Congress contributed to this. During the late evening of December 17, February futures were traded for gold on the New York Mercantile Exchange at $ 1,889.60 an ounce. Gold futures for February delivery increased by 1.7% to $ 1,890.40 an ounce starting from Thursday until today, December 18. Experts consider this to be the highest level recorded since November 6 this year. Today, gold trading in pairs with the US dollar, tries not to slow down. The XAU/USD pair moves around $ 1884 per ounce. According to analysts, gold took its chance to rise amid the dollar's weakness, declining real yields on US government bonds and growing inflation risks caused by the Fed's soft monetary policy. 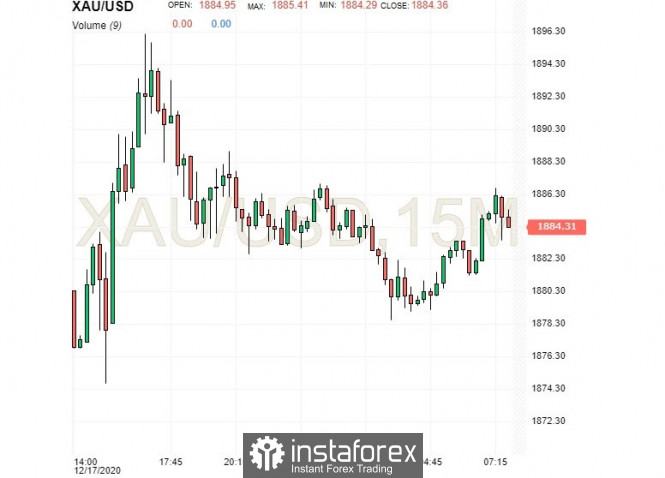 Brien Lundin, currency strategist at Gold Newsletter, observed that the Fed's December meeting for the past five years has often become the starting point of the rally in the prices of precious metals. Analyst emphasizes that this primarily applies to gold. As a rule, the rally of precious metals, which started at the end of the current year, continues in the next one. Experts enumerated the key drivers to the growth of gold's prices. These include the US dollar's clear downward movement, Fed's continued soft monetary policy, and a number of new stimulating measures in the US, whose target is to increase unemployment benefits and support small businesses. At the same time, one-time payments are provided for those citizens who find it difficult to find work. American lawmakers are busy preparing a program of this financial assistance in the amount of $ 900 billion. Based on preliminary information, this package will include direct payments per citizen in the amount of $ 600, and $ 325 billion to support small businesses. In fact, gold gained huge popularity during the COVID-19 pandemic. Many investors actively invested in this metal and continue to do so until now. Market participants bet on the precious metal, considering this asset a reliable guarantee against the depreciation of national currencies. The negative forecasts for 2021 for the US dollar also contributed to this. Many analysts are sure that the USD will remain under pressure next year and will drop another 10%. Fearing such a scenario, investors are massively turning to the yellow metal, which is not afraid of inflation risks. The specialists consider precious metals to be the most important instrument for hedging market volatility and protection against negative interest rates. According to current forecasts, gold prices are expected to reach $ 2,000 per ounce in 2021. This optimism is supported by the conclusions of experts, who called gold as one of the most profitable assets of the current year. Moreover, gold is expected to appreciate due to different factors such as rising inflation expectations, weakening US dollar, and growing demand for investment. Experts believe that the decline in US government bond yields and negative interest rates will give an advantage to the precious metal. They concluded that the combination of these conditions will increase its popularity for investors in 2021. GBP/USD and EUR/USD: Pound plummets after some details of the Brexit negotiations were revealed. Meanwhile, the state of the US labor market is deteriorating, which creates problems to the US economy. 2020-12-18 GBP: Some details of the Brexit negotiations were revealed. They disappointed traders who were hoping for a deal to be signed this week, as they clearly suggest that such will not happen. And because of this, demand for the pound plummeted sharply, therefore, it would be risky to open long positions at the current highs. It is more rational to proceed from the technical correction, as such may intensify today.  Nonetheless, at the moment, the target of pound bulls is to return the quote to 1.3560. Then, good data on UK retail sales will pull it up even higher to 1.3620, a break of which will make it easier for the pound to reach the 37th figure, in particular, the level of 1.3760. But if the pressure on GBP / USD persists, the quote will drop to 1.3360. Going back to the negotiations, UK Prime Minister Boris Johnson said it may fail if the EU does not soften its position on fisheries. He called the EU's demands unreasonable. As for European Commission President Ursula von der Leyen, she said it will be quite difficult to overcome the existing differences on the issue. But despite this pessimistic rhetoric, officials in Brussels have expressed confidence that a deal could be closed before next week. They said that behind the scenes, the negotiations are moving in the right direction, and emerging negative statements from both the EU and the UK are common negotiation tactics to exert pressure. The remaining issue that hinders the concussion of a deal is the access of European fishing vessels to UK waters. The problem has minimal economic impact - the industry accounts for only 0.12% of the UK's GDP - but has a lot of political implications. This industry employs only 24,000 workers, which, for the EU economy, is practically "nothing". However, the EU wishes to have access to the UK's rich fishing waters in the future, as more than half of the fish and shellfish caught in UK waters come from EU countries. The UK wants to regain control of its economic zone (which is about 200 nautical miles under international law) and withdraw from the EU fisheries agreement, which sets quotas on how much and what kind of fish EU countries can catch. 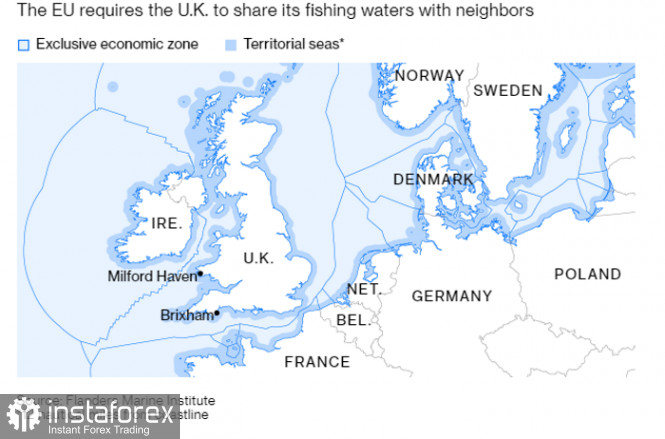 Political analysts said that if both parties failed to sign a deal just because of this issue, it likely means that one of them is not ready to enter an agreement from the very beginning. In another note, the pound's growth earlier this week was driven by the rumors that a compromise has been found on the problem of equal competitive conditions for business. Then, yesterday, the European Parliament increased pressure on negotiators by setting the deadline on Sunday. Therefore, by that time, the UK and the EU must ratify an agreement. USD: The US dollar collapsed after data emerged that US jobless claims rose amid the second COVID-19 outbreak. The report published by the Department of Labor said initial jobless claims jumped 885,000 between December 6 and 12, while economists expected a drop in the figure. Secondary applications also rose to 812,500, which suggests that it is high time to start worrying about the state of employment again, because conditions will only worsen amid the continuous spread of the coronavirus. The results of the vaccination will be seen next year, but for now, restrictive measures and pressure on the service sector will force business owners to fire people to minimize costs. Current government aid programs are inadequate, and the supposed $ 900 billion new US package is once again suspended. This weak data on jobless claims is likely to have a negative impact on the overall nonfarm payrolls report due in early January 2021. 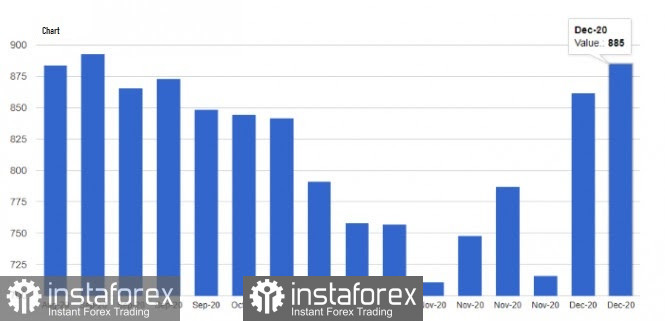 On a positive note, housing starts in the US increased in November, as apparently, demand rose amid very low interest rates. The report published by the US Department of Commerce said they increased by 1.2% to the previous month, and compared to 1.547 million units per year. The Economists had expected the figure to drop by 0.7% and amount to only 1.52 million units per year. As for economic activity, Kansas City Fed said the composite index jumped to 14 points in December, while economists had expected it to be 10.0 points only. Strong growth in manufacturing activity is a sign of a healthy sector, even as the coronavirus spreads. Meanwhile, the report from the Philadelphia Fed was not smooth, as according to the data, business activity in the area fell to 11.1 points this December, while economists had expected it to be 20.0 points. But this slowdown in activity is not a serious problem yet, since the growth of the production sector in the region continues, albeit at a slower pace. 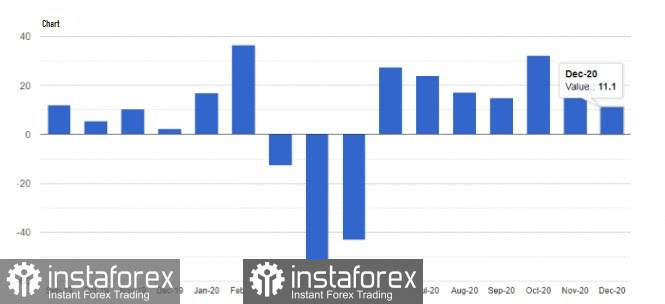 With regards to the EUR/USD pair, the bulls are currently trying to break the quote above 1.2271, as going beyond which will form a new strong upward trend. If they succeed, the euro could reach the levels 1.2305 and 1.2340. But if there is no activity on the part of buyers near the yearly highs, EUR/USD may decline to 1.2225, and then to 1.2180.
Author's today's articles: Stanislav Polyanskiy  Graduated from Odessa State Economic University. On Forex since 2006. Writes analytical reviews about international financial markets for more than 3 years. Worked as a currency analyst in different finance companies for a long time including the biggest companies of Russia and Ukraine. Graduated from Odessa State Economic University. On Forex since 2006. Writes analytical reviews about international financial markets for more than 3 years. Worked as a currency analyst in different finance companies for a long time including the biggest companies of Russia and Ukraine. Vyacheslav Ognev  Vyacheslav was born on August 24, 1971. In 1993, he graduated from Urals State University of Economics in the Russian city of Ekaterinburg holding a degree in Commerce and Economics of Trade. In 2007, he started concentrating on the Russian stock market, trading stocks on the RTS Stock Exchange and futures contracts on FORTS. Since 2008 he has been engaged in analyzing Forex market and trading currencies. He is an author of a simplified wave analysis method. He has also developed a trading strategy. At present, Vyacheslav is a co-author of training materials on two web portals dedicated to Forex trading education. Interests: fitness, F1 "Experience is the best of schoolmasters, only the school fees are heavy." - Thomas Carlyle Vyacheslav was born on August 24, 1971. In 1993, he graduated from Urals State University of Economics in the Russian city of Ekaterinburg holding a degree in Commerce and Economics of Trade. In 2007, he started concentrating on the Russian stock market, trading stocks on the RTS Stock Exchange and futures contracts on FORTS. Since 2008 he has been engaged in analyzing Forex market and trading currencies. He is an author of a simplified wave analysis method. He has also developed a trading strategy. At present, Vyacheslav is a co-author of training materials on two web portals dedicated to Forex trading education. Interests: fitness, F1 "Experience is the best of schoolmasters, only the school fees are heavy." - Thomas Carlyle Sergey Belyaev  Born December 1, 1955. In 1993 graduated from Air Force Engineering Academy. In September 1999 started to study Forex markets. Since 2002 has been reading lectures on the technical analysis . Is fond of research work. Created a personal trading system based on the indicator analysis. Authored the book on technical analysis "Calculation of the next candlestick". At present the next book is being prepared for publishing "Indicator Analysis of Forex Market. Trading System Encyclopedia". Has created eleven courses on indicator analysis. Uses classical indicators. Works as a public lecturer. Held numerous seminars and workshops presented at international exhibitions of financial markets industry. Is known as one of the best specialists in the Russian Federation researching indicator analysis. Born December 1, 1955. In 1993 graduated from Air Force Engineering Academy. In September 1999 started to study Forex markets. Since 2002 has been reading lectures on the technical analysis . Is fond of research work. Created a personal trading system based on the indicator analysis. Authored the book on technical analysis "Calculation of the next candlestick". At present the next book is being prepared for publishing "Indicator Analysis of Forex Market. Trading System Encyclopedia". Has created eleven courses on indicator analysis. Uses classical indicators. Works as a public lecturer. Held numerous seminars and workshops presented at international exhibitions of financial markets industry. Is known as one of the best specialists in the Russian Federation researching indicator analysis. Torben Melsted  Born in November 1962. Graduated from CBS, got Diploma in Finance. Began trading on Forex in 1986 and since that time held various positions such as advising clients, hedging client flows on FX and commodity markets. Also worked for major corporations as Financial Risk Manager. Uses Elliott wave analysis in combination with classic technical analysis, and has been using a Calmar Ratio of 5.0 for over 3 years. Has his own blog, where he uses Elliott wave and technical analysis on all financial markets. Born in November 1962. Graduated from CBS, got Diploma in Finance. Began trading on Forex in 1986 and since that time held various positions such as advising clients, hedging client flows on FX and commodity markets. Also worked for major corporations as Financial Risk Manager. Uses Elliott wave analysis in combination with classic technical analysis, and has been using a Calmar Ratio of 5.0 for over 3 years. Has his own blog, where he uses Elliott wave and technical analysis on all financial markets. Sebastian Seliga  Sebastian Seliga was born on 13th Oсtober 1978 in Poland. He graduated in 2005 with MA in Social Psychology. He has worked for leading financial companies in Poland where he actively traded on NYSE, AMEX and NASDAQ exchanges. Sebastian started Forex trading in 2009 and mastered Elliott Wave Principle approach to the markets by developing and implementing his own trading strategies of Forex analysis. Since 2012, he has been writing analitical reviews based on EWP for blogs and for Forex websites and forums. He has developed several on-line projects devoted to Forex trading and investments. He is interested in slow cooking, stand-up comedy, guitar playing, reading and swimming. "Every battle is won before it is ever fought", Sun Tzu Sebastian Seliga was born on 13th Oсtober 1978 in Poland. He graduated in 2005 with MA in Social Psychology. He has worked for leading financial companies in Poland where he actively traded on NYSE, AMEX and NASDAQ exchanges. Sebastian started Forex trading in 2009 and mastered Elliott Wave Principle approach to the markets by developing and implementing his own trading strategies of Forex analysis. Since 2012, he has been writing analitical reviews based on EWP for blogs and for Forex websites and forums. He has developed several on-line projects devoted to Forex trading and investments. He is interested in slow cooking, stand-up comedy, guitar playing, reading and swimming. "Every battle is won before it is ever fought", Sun Tzu Maxim Magdalinin  In 2005 graduated from the Academy of the Ministry of Internal Affairs of the Republic of Belarus, law faculty. Worked as a lawyer for three years in one of the biggest country's company. Besides the trading, he develops trading systems, writes articles and analytical reviews. Works at stock and commodity markets explorations. On Forex since 2006. In 2005 graduated from the Academy of the Ministry of Internal Affairs of the Republic of Belarus, law faculty. Worked as a lawyer for three years in one of the biggest country's company. Besides the trading, he develops trading systems, writes articles and analytical reviews. Works at stock and commodity markets explorations. On Forex since 2006. l Kolesnikova  text text Pavel Vlasov  No data No data
Subscription's options management Theme's:
Fundamental analysis, Fractal analysis, Wave analysis, Technical analysis, Stock Markets
Author's :
A Zotova, Aleksey Almazov, Alexander Dneprovskiy, Alexandr Davidov, Alexandros Yfantis, Andrey Shevchenko, Arief Makmur, Dean Leo, Evgeny Klimov, Fedor Pavlov, Grigory Sokolov, I Belozerov, Igor Kovalyov, Irina Manzenko, Ivan Aleksandrov, l Kolesnikova, Maxim Magdalinin, Mihail Makarov, Mohamed Samy, Mourad El Keddani, Oleg Khmelevskiy, Oscar Ton, Pavel Vlasov, Petar Jacimovic, R Agafonov, S Doronina, Sebastian Seliga, Sergey Belyaev, Sergey Mityukov, Stanislav Polyanskiy, T Strelkova, Torben Melsted, V Isakov, Viktor Vasilevsky, Vladislav Tukhmenev, Vyacheslav Ognev, Yuriy Zaycev, Zhizhko Nadezhda
Edit data of subscription settings
Unsubscribe from the mailing list Sincerely,
Analysts Service | If you have any questions, you can make a phone call using one of the
InstaForex Toll free numbers right now:
|  | InstaForex Group is an international brand providing online trading services to the clients all over the world. InstaForex Group members include regulated companies in Europe, Russia and British Virgin Islands. This letter may contain personal information for access to your InstaForex trading account, so for the purpose of safety it is recommended to delete this data from the history. If you have received this letter by mistake, please contact InstaForex Customer Relations Department. |


No comments:
Post a Comment