| Technical analysis for EUR/USD pair for the week of December 14-19, 2020 2020-12-14 Last week, the pair declined after rebounding from the resistance level of 1.2177 (yellow bold line), but strong news on Thursday nullified all the work of the bears, which resulted in a side channel on the weekly candle. This week, the price will most likely resume its upward movement. Trend analysis The price from the level of 1.2111 (closing of the last weekly candle) may continue to increase this week to the first target, which is the resistance level of 1.2177 (yellow bold line). Upon reaching this level, the upward movement can continue to the target of 1.2274 – a pullback level of 85.4% (blue dotted line). 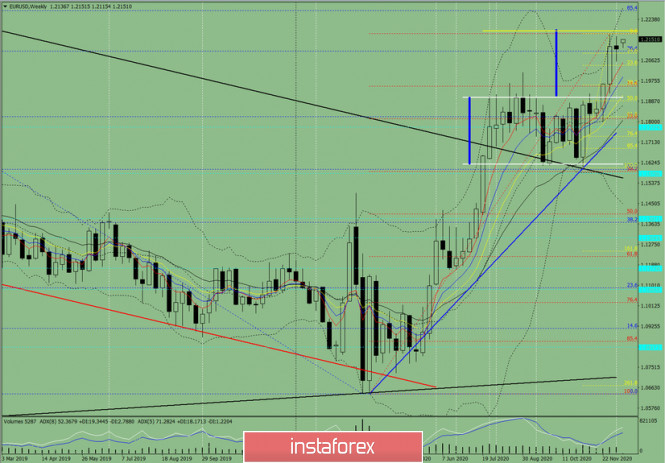
Figure 1 (weekly chart) Comprehensive analysis: - indicator analysis - up; - Fibonacci levels - up; - volumes - up; - candlestick analysis - up; - trend analysis - up; - Bollinger lines - up; - monthly chart - up. An upward movement can be concluded based on comprehensive analysis. The overall result of the candlestick calculation on the weekly chart: the price is likely to have an upward trend this week, with no lower shadow in the weekly white candlestick (Monday - up) and no upper shadow (Friday - up). The first upward target is the resistance level of 1.2177 (yellow bold line). Upon reaching this level, the upward movement will continue to the target of 1.2274 – a pullback level of 85.4% (blue dotted line). An unlikely scenario: the price from the level of 1.2111 (closing of the last weekly candle) may decline to the target of 1.1952 – a pullback level of 14.6% (red dotted line). Upon reaching this level, it can move to the upward target, which is the resistance level of 1.2177 (yellow bold line). Technical analysis for GBP/USD pair for the week of December 14-19, 2020 2020-12-14 The pair tested the 13th average, EMA 1.3141 (yellow thin line) while declining last week, but the weekly candle closed above 1.3225 (red dotted line) – a pullback level of 14.6%. This week, the price will most likely continue to rise. Trend analysis The price from the level of 1.3234 (closing of the last weekly candle) is expected to rise to the first target of 1.3384 – the historical resistance level (blue dotted line). If this level is reached, it is possible to further move upwards to the target of 1.3538 - the upper fractal (red dashed line). 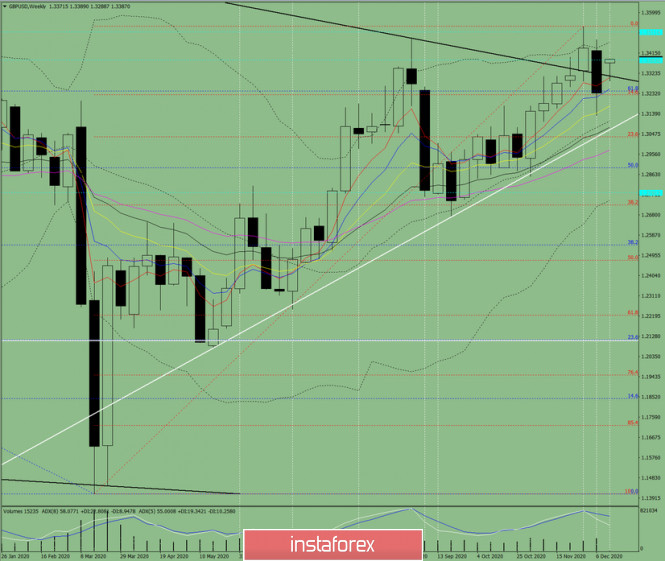
Figure 1 (weekly chart). Comprehensive analysis: - indicator analysis - up; - Fibonacci levels - up; - volumes - up; - candlestick analysis - up; - trend analysis - up - Bollinger lines - up; - monthly chart - up. An upward movement can be concluded based on comprehensive analysis. The overall result of the candlestick calculation on the weekly chart: the price is likely to have an upward trend this week, with the presence of the first lower shadow in the weekly white candlestick (Monday - down) and without the second upper shadow (Friday - down). The first upward target is 1.3384 – the historical resistance level (blue dotted line). If this level is reached, it is possible to further rise to the target of 1.3538 – the upper fractal (red dashed line). An alternative scenario: the price from the level of 1.3234 (closing of the last weekly candle) will move up to the first target of 1.3384 - the historical resistance level (blue dotted line). After reaching this level, it is possible to decline to the target of 1.3225 – the pullback level of 14.6% (red dotted line). Trading idea for gold 2020-12-14  Many analytical reviews have instructed buying gold to get profit, but technical analysis says the current bullish scenario is a trap. 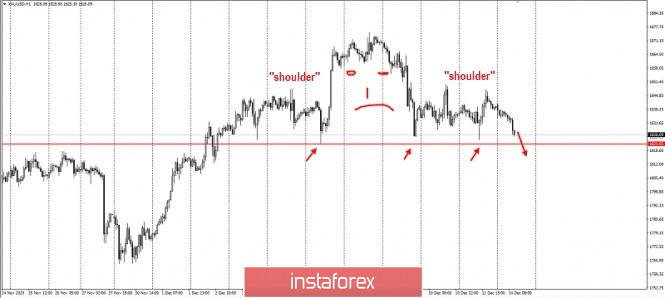 Apparently, the current pattern is what we call "head and shoulders", in which the "right shoulder" of the figure is the classic ABC structure that we trade regularly. Objectively, this is a classic trap for sellers who have no place to hide their risks except at the level of 1821. Therefore, if you want to buy gold with relatively short stops, don't do it at least until the false breakdown of 1821. But if you are selling, as instructed in the previous trading recommendation , take profit at the breakout of 1821. These follow the Price Action and Stop Hunting methods. Of course, you still need to be careful since this financial market is very precarious. But, it will give plenty of profit provided that you use the right approach. Good luck! EUR/USD analysis for December 14, 2020. Supreme court rejects Trump-backed Texas lawsuit 2020-12-14 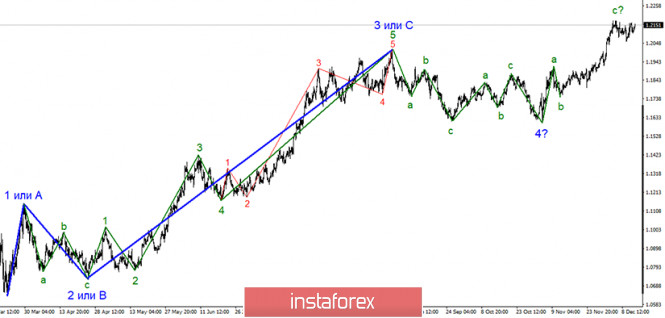
The wave pattern for the EUR/USD pair still indicates the formation of the upward trend. The upward wave 'c' continues its formation. It made a successful attempt to break through the high of the wave 3 or 'C'. The current ascending section of the trend may turn into a five-wave structure as the formation of new three waves has been completed. In this case, the entire wave pattern may become complex. Nevertheless, all this may indicate the upcoming downward reversal. 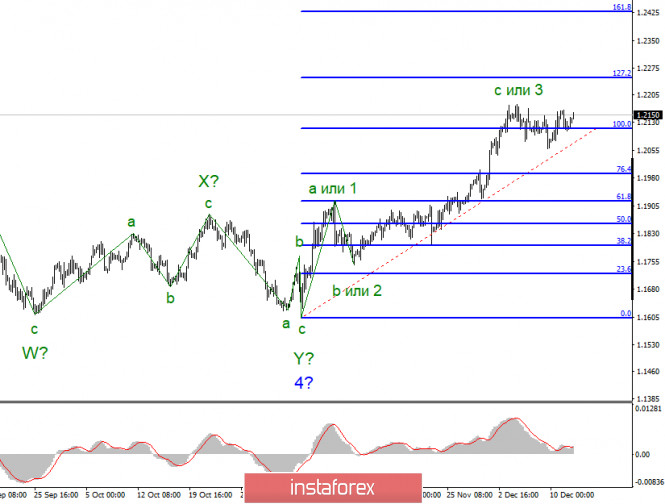
The wave pattern in a lower time frame also indicates that the formation of a new three-wave section of the trend continues. Alternatively, the wave pattern of the trend section, which started on November 4, may transform into a five-wave structure. At the same time, the trend may be completed by the formation of the wave 'C', followed by three new descending waves. Meanwhile, the pair went above its earlier high. The continuation of the uptrend indicates that the market is ready to continue buying the pair. Friday was not a busy day in the eurozone and the United States. In fact, nothing interesting happened. Markets reacted positively to the outcome of the ECB meeting, although there was nothing optimistic. Otherwise, it also might be that the negative market reaction to the results of the ECB meeting was very restrained. Therefore, the general upward sentiment remained. Nevertheless, the wave-pattern already indicates the formation of a new upward wave. Moreover, the whole uptrend section will become more complex. Apart from that, markets paid little attention to the results of the EU summit. In the course of the summit, Poland and Hungary lifted their veto on the recovery fund and the 2021-2027 budget. Still, the instrument is trading near the highest level of the year. Meanwhile, nothing important happens in the United States. After the presidential election has ended, practically no information comes from either Donald Trump or Joe Biden. The stimulus package for the American economy was never agreed. A week ago, it was reported that a bipartisan group of lawmakers in the House and Senate unveiled a $900 billion stimulus plan but that was all about it. Donald Trump still believes in his victory, whereas courts in almost all American states continue to reject his voter-fraud lawsuit. Last week, the US Supreme Court rejected a lawsuit filed by Texas and seventeen other states for the lack of evidence from the accusing party. This clearly shows that Trump lost the election. General conclusion and recommendations: The euro/dollar pair is currently trading in an upward trend. Thus, I recommend that you be extremely careful when buying the instrument. So far, there have been no signals for the upward wave-construction to end its formation. Despite the fact that the wave 5 is currently being formed, it will be completed soon. Nevertheless, it is still possible to buy the pair following each of the new MACD buy signals with the targets set near 1.2250, which corresponds to the 127.2% Fibonacci extension level. EUR/USD analysis for December 14 2020 - Broken bull flag pattern on the daily and potential for test of 1.2400 2020-12-14 Eurozone October industrial production +2.1% vs +2.0% m/m expected Prior -0.4%; revised to +0.1% - Industrial production WDA -3.8% vs -4.4% y/y expected
- Prior -6.8%; revised to -6.3%
Industrial production picking up a touch and higher revisions will be welcome news for Q4. The EURUSD is supported this am on the Dollar weakness. One area to watch is that if the EUR becomes too strong we may see some ECB jawboning. A strong euro is not good for European exporters. Further Development 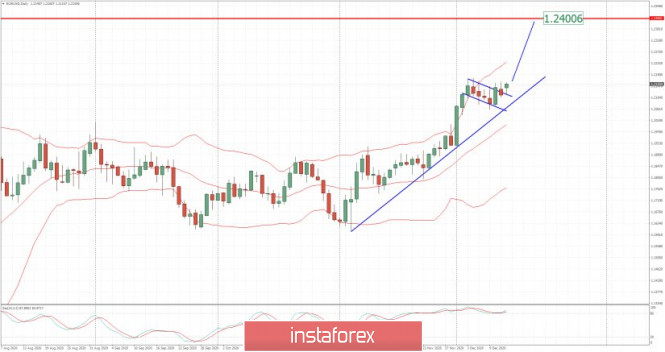
Analyzing the current trading chart of EUR/USD, I found that the buyers are still in control and that we got breakout of the bullish flag pattern in the background based on the daily time-frame. My advice is to watch for buying opportunities on the dips using the intraday time-frame, with the upside target at the price of 1,2400. 1-Day relative strength performance Finviz 
Based on the graph above I found that on the top of the list we got Ethanol and Natural Gas today and on the bottom VIX and Orange Juice. EUR is trading in the positive territory, which is positive sign for continuation... Key Levels: Resistance: 1,2175 and 1,2400 Support level: 1,2065 Analysis of Gold for December 14,.2020 - Watch for buying opportuntiies with the target at $1.847 2020-12-14 Eurozone October industrial production +2.1% vs +2.0% m/m Brexit: Von der Leyen, 'We want a level playing field' - Fine about the architecture of the trade deal, but details are crucial
- On the last mile of negotiations
Once/if the level playing field is resolved then that should seal the deal. Definite shift in sentiment over Brexit negotiations this am with more upbeat tones all round. Will it last? My view is that we will get there, but I am not buying the GBP on that view. Prudent action is to stay tuned and then probably look for a buy the rumour, sell the fact response. 
Further Development 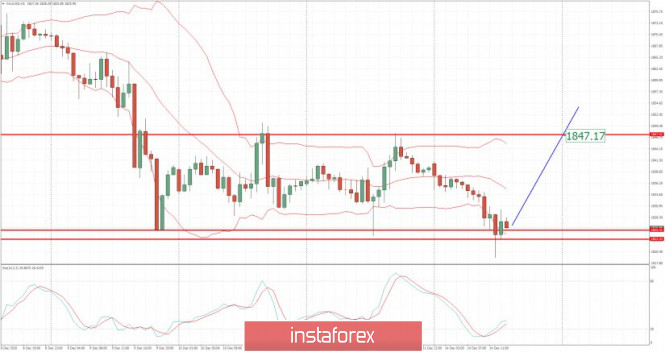
Analyzing the current trading chart of Gold, I found that there is potential for the another upside movement due to accumulation that I have found. My advice is to watch for buying opportunities with the potential target at $1,847. I also found the fake breakout of th support at $1,823., which is another confirmation for fhe further rise. 1-Day relative strength performance Finviz 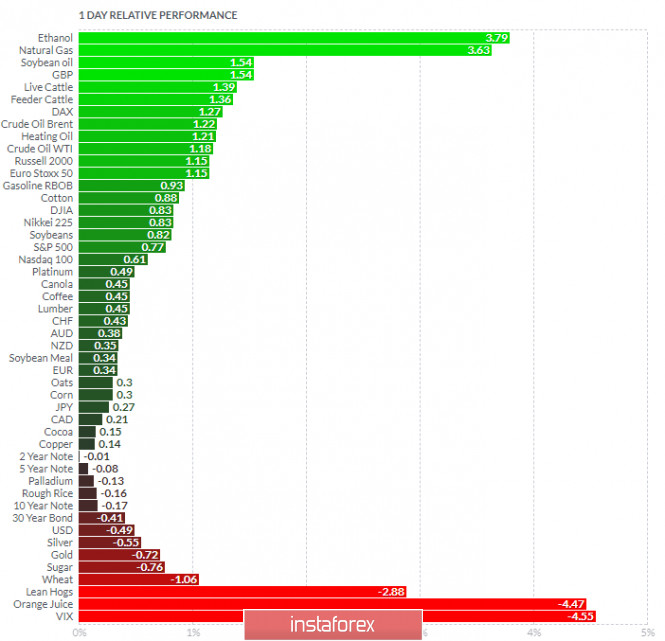
Based on the graph above I found that on the top of the list we got Ethanol and Natural Gas today and on the bottom VIX and Orange Juice. Key Levels: Resistance: $1,847 Support level: $1,825/2
Author's today's articles: Sergey Belyaev  Born December 1, 1955. In 1993 graduated from Air Force Engineering Academy. In September 1999 started to study Forex markets. Since 2002 has been reading lectures on the technical analysis . Is fond of research work. Created a personal trading system based on the indicator analysis. Authored the book on technical analysis "Calculation of the next candlestick". At present the next book is being prepared for publishing "Indicator Analysis of Forex Market. Trading System Encyclopedia". Has created eleven courses on indicator analysis. Uses classical indicators. Works as a public lecturer. Held numerous seminars and workshops presented at international exhibitions of financial markets industry. Is known as one of the best specialists in the Russian Federation researching indicator analysis. Born December 1, 1955. In 1993 graduated from Air Force Engineering Academy. In September 1999 started to study Forex markets. Since 2002 has been reading lectures on the technical analysis . Is fond of research work. Created a personal trading system based on the indicator analysis. Authored the book on technical analysis "Calculation of the next candlestick". At present the next book is being prepared for publishing "Indicator Analysis of Forex Market. Trading System Encyclopedia". Has created eleven courses on indicator analysis. Uses classical indicators. Works as a public lecturer. Held numerous seminars and workshops presented at international exhibitions of financial markets industry. Is known as one of the best specialists in the Russian Federation researching indicator analysis. Andrey Shevchenko  Andrey Shevchenko Andrey Shevchenko Alexander Dneprovskiy  Graduated from Kiev State University of Economics. On Forex market since 2007. Started his work at Forex as a trader. Since 2008 is working as a currency analyst. Graduated from Kiev State University of Economics. On Forex market since 2007. Started his work at Forex as a trader. Since 2008 is working as a currency analyst. Petar Jacimovic  Petar was born on July 08, 1989 in Serbia. Graduated from Economy University and after has worked as a currency analyst for large private investors. Petar has been involved in the world of finance since 2007. In this trading he specializes in Volume Price Action (volume background, multi Fibonacci zones, trend channels, supply and demand). He also writes the market analytical reviews for Forex forums and websites. Moreover Petar is forex teacher and has wide experience in tutoring and conducting webinars. Interests : finance, travelling, sports, music "The key to success is hard work" Petar was born on July 08, 1989 in Serbia. Graduated from Economy University and after has worked as a currency analyst for large private investors. Petar has been involved in the world of finance since 2007. In this trading he specializes in Volume Price Action (volume background, multi Fibonacci zones, trend channels, supply and demand). He also writes the market analytical reviews for Forex forums and websites. Moreover Petar is forex teacher and has wide experience in tutoring and conducting webinars. Interests : finance, travelling, sports, music "The key to success is hard work"
Subscription's options management Theme's:
Fundamental analysis, Fractal analysis, Wave analysis, Technical analysis, Stock Markets
Author's :
A Zotova, Aleksey Almazov, Alexander Dneprovskiy, Alexandr Davidov, Alexandros Yfantis, Andrey Shevchenko, Arief Makmur, Dean Leo, Evgeny Klimov, Fedor Pavlov, Grigory Sokolov, I Belozerov, Igor Kovalyov, Irina Manzenko, Ivan Aleksandrov, l Kolesnikova, Maxim Magdalinin, Mihail Makarov, Mohamed Samy, Mourad El Keddani, Oleg Khmelevskiy, Oscar Ton, Pavel Vlasov, Petar Jacimovic, R Agafonov, S Doronina, Sebastian Seliga, Sergey Belyaev, Sergey Mityukov, Stanislav Polyanskiy, T Strelkova, Torben Melsted, V Isakov, Viktor Vasilevsky, Vladislav Tukhmenev, Vyacheslav Ognev, Yuriy Zaycev, Zhizhko Nadezhda
Edit data of subscription settings
Unsubscribe from the mailing list Sincerely,
Analysts Service | If you have any questions, you can make a phone call using one of the
InstaForex Toll free numbers right now:
|  | InstaForex Group is an international brand providing online trading services to the clients all over the world. InstaForex Group members include regulated companies in Europe, Russia and British Virgin Islands. This letter may contain personal information for access to your InstaForex trading account, so for the purpose of safety it is recommended to delete this data from the history. If you have received this letter by mistake, please contact InstaForex Customer Relations Department. |


No comments:
Post a Comment