| Gold grows simultaneously with US stocks amid inflation 2020-10-14 Gold continues to hang around the mark of $1,900 per ounce, while the arguments of its fans look unconvincing. According to RBC Wealth Management, the precious metal has postponed the hike to $2000, but its long-term prospects remain bullish. Failures in COVID-19 vaccine trials, political uncertainty, and a slow global economic recovery are allegedly playing into the hands of XAU/USD buyers. In my opinion, they work as one with the US dollar for being bearish factors for gold. To make this convincing, you need to look at the dynamics of the precious metal and US stock indexes. In March, gold was caught in a wave of sell-offs amid the collapse of the S&P 500, as investors sought cash to support longs on stocks. In September, history repeated itself. The analyzed asset behaves as risky, which makes its use as a hedging tool for price risks of the investment portfolio ineffective. In fact, we need to understand what kind of environment we live in. It is inflationary. That is, the stock market is growing in the hope of accelerating CPI, and the precious metal has been used for centuries as an insurance against inflation. This is why it is directly correlated with US stock indexes. Stocks are rallying on hopes of a new fiscal stimulus package that will boost the US economy and boost consumer prices. As a result, the real yield on Treasury bonds will fall, which is good news for the bulls on XAU/USD. By contrast, the failure of the White House and Congress to provide additional assistance will reduce the likelihood of accelerating inflation, which will be bad news for both the S&P 500 and gold. But it will help the US dollar. Dynamics of Gold and US dollar: 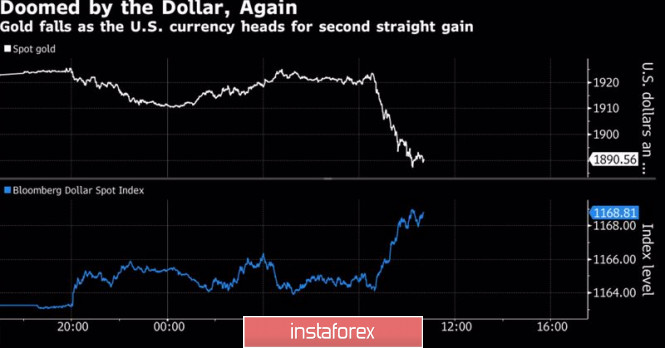
The greenback gets support from uncertainty. According to a BofA Merrill Lynch poll, 61% of financial managers with $593 billion under management believe that Donald Trump will challenge the results of the presidential election. Recently, the market is increasingly hearing talk that Joe Biden's victory does not guarantee the rapid implementation of additional fiscal incentives. They say this is possible if the Democrats control both the White House and Congress, but many investors believe that the Republicans will not give up the Senate. The lack of additional assistance is a reason for the correction of stock indexes and XAU/USD against the background of a decrease in the probability of inflation acceleration. Currently, the cost of hedging the risks of consumer price acceleration above 2% over the next five years exceeds the February premium by half, but the continued uncertainty will reduce the indicator and hit gold. Technically, on the daily chart, there was a retest of the lower border of the shelf (trading range $1930-1990 per ounce) of the "surge and shelf" pattern. The inability of the bulls to break higher indicates their weakness. However, it makes sense to form medium-term sell or buy trades only after gold falls below $1860 or rises above $1960 (mid-shelf). Gold, daily chart: 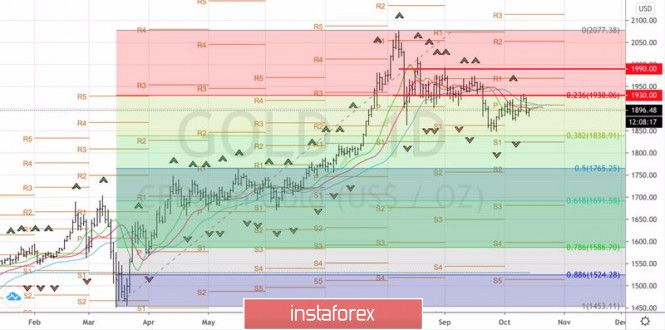
Technical recommendations for EUR/USD and GBP/USD on October 14 2020-10-14 EUR / USD 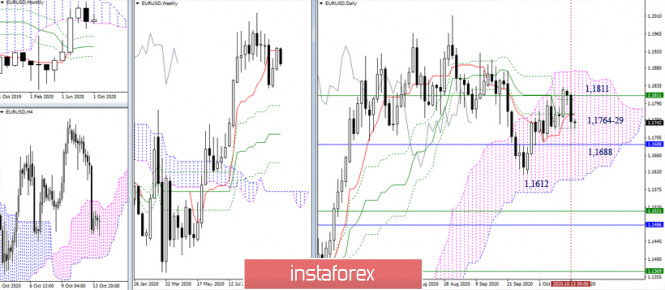 The resistance of the weekly short-term trend (1.1811) still managed to block the way for the bulls, who are now pushed back to the supports of the daily cross (1.1764-29). In the current situation, it is important for the bears to form and fix a weekly pullback, while consolidating below the lower limit of the monthly cloud (1.1688). Further, it will be important to enter the bearish zone relative to the daily Ichimoku cloud and restore the downward trend (1.1612). In case of failures and inability to implement the set tasks, it will contribute to consolidation and new attempts by the opponent to get support from the weekly short-term (1.1811). 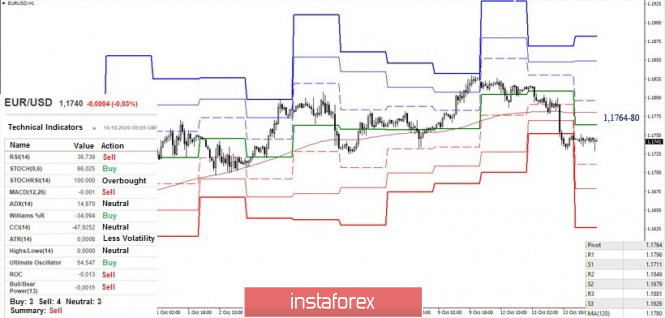 In the smaller time frames, the bears achieved a full advantage. The next downward targets within the day are the support levels of 1.1711 - 1.1679 - 1.1626. On the other hand, the key resistances are located at the level of 1.1764-80 (central pivot level + weekly long-term trend). In case of consolidation above, the bulls will balance out the current gains of the opponent and may consider testing opportunities again with the goal of breaking the weekly short-term (1.1811). GBP / USD 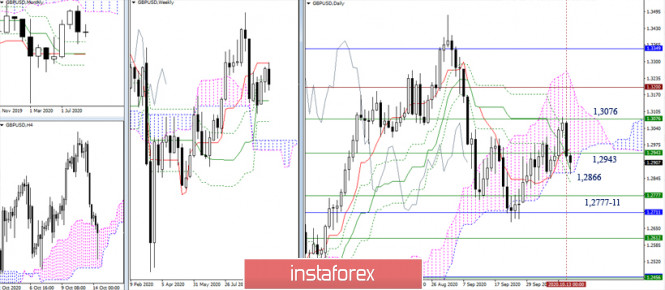 Reaching the weekly short-term trend (1.3076) caused the daily rebound to be formed. The bears are now testing important limits – the final levels of the daily cross and the lower border of the daily cloud (1.2866). A reliable consolidation below will allow them to make further plans to strengthen their moods. Now, working in the daily cloud and returning support (daily cross + weekly Fibo Kijun 1.2943) will help the bulls to smoothen bearish successes, and then completely re-outline a new attack on the resistance of 1.3076 (weekly Tenkan).  At the moment, the advantage is on the bears' side, who are testing the strength of the first support level (1.2879), and continue further to the next levels located at 1.2827 (S2) and 1.2732 (S3). Today, the key levels of the smaller time frames are joining forces at 1.2974 (center pivot level + weekly long-term trend) and working below which will help maintain bearish plans. Ichimoku Kinko Hyo (9.26.52), Pivot Points (classical), Moving Average (120) EUR/USD: Outlook for risky assets is deteriorating. A new wave of growth is brewing in the US dollar. 2020-10-14 IMF's report on global financial stability, together with the sharp drop in business confidence in the eurozone, left no chance for risky assets to recover further in the market. Then, the United States released a relatively good report on inflation, thereby finishing off those who believed in the continued strengthening of the euro in the short term.  Yesterday, the International Monetary Fund presented a report on global financial stability, which indicated the growing vulnerability of some countries. Most likely, this refers to Europe, particularly Italy and Spain, as these two countries have every chance to break record lows this year. The IMF also warned of the risks of taking more and more debts amid the pandemic, which the Federal Reserve has been doing in the United States. Nonetheless, the organization tweaked its economic forecast for 2020, leaning on a somewhat less severe recession in the world GDP than its prediction last June. It believes that the world GDP will only contract by 4.4% in 2020, while the US GDP will shrink by 4.3% and then grow by 3.1% in 2021. The global recovery will be long, uneven and uncertain over the medium term, which suggests that developed countries will continue implementing a zero interest rate program, pumping money into their economies, thereby creating fertile ground for higher inflation in the future. As for economics statistics, a very weak data was released for business confidence in Germany, and the reason for this was the deteriorating situation with the coronavirus, as well as the slowing economic recovery. Most of the sharp decline was seen in sentiment about the economic outlook, which, until now, remains bleak in the eurozone. Growth was recorded only in the indicator of ZEW. So, according to the ZEW Institute for Economic Research, the index of economic sentiment in Germany fell to 56.1 in October, much lower than its previous level, which was 77.4 points. Meanwhile, the assessment of the current economic situation rose to -59.5 points from -66.2 points in September, while economists had expected the figure to be -72.0. 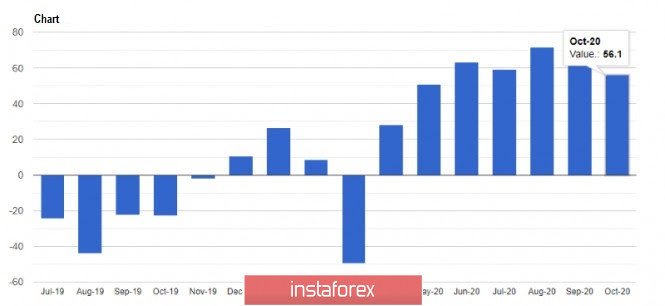 Low inflation was also recorded in Germany, to which Destatis reported a 0.2% decrease in the final consumer price index in September, amounting to just 0.4%. This reaffirms that there is a need for larger stimulus from the European Central Bank. However, the decline could also be just because of the reduction in VAT, which operates within the framework of the fiscal policy of Germany, which came into force on July 1 this year. Meanwhile, the United States, unlike Germany, has seen a huge rise in inflation, increasing by 0.2% in September as compared to its level in August. The core CPI, which excludes volatile product categories, also gained 0.2%. The main reason for this increase was the 6.7% jump in prices for used cars, as there was a huge demand for vehicles after the first wave of the coronavirus pandemic. Prices have also increased in restaurants by 0.6%, which further fans inflation in the country. The growth was partially offset by a sharp drop in gasoline prices, where the indicator fell immediately by 5.3%. A slowdown will occur only if tougher restrictive social distancing measures are introduced. 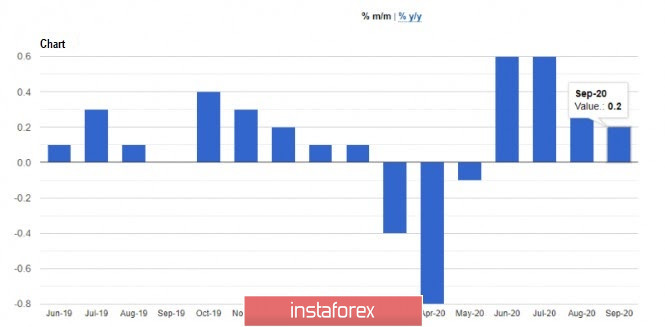 The health of small businesses also continues to improve in the US, which signifies a normal economic recovery in the country. The report published by the National Federation of Independent Business said that the US Small Business Optimism Index rose to 104.00 points in September, up from its 100.2 points in August this year. Economists had expected the index to only reach 101.3. Positive sentiment among top managers of small companies is a good signal for the economy, as it will lead to increased investment and the creation of new jobs. With regards to the EUR/USD pair, the outlook continues to deteriorate, but for this to come to the fore, the bears need to push the quote below the support level of 1.1735, as such will make it easier for the euro to reach the price levels 1.1680 and 1.1640. However, if demand for risky assets returns, although this is unlikely under the current conditions and statistics, the quote could return above the level of 1.1780, which will make it easier for the bulls to move back to weekly highs 1.1825 and 1.1870. Technical analysis of GBP/USD for October 14, 2020 2020-10-14 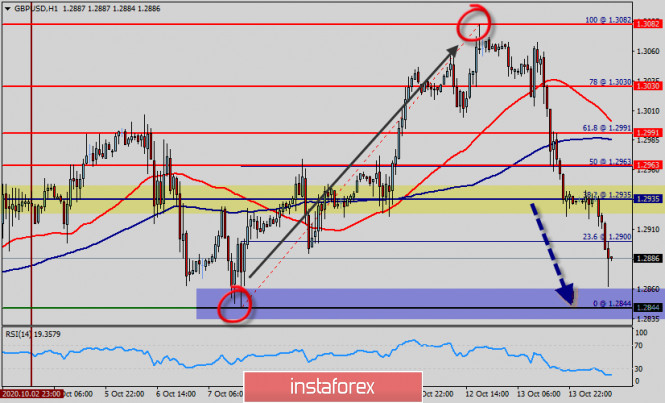 Overview : After breaking the support at 1.2935. The GBP/USD pair has set strong resistances at the levels of 1.2935 because the support has become a resistance. So, the price has already formed the strong resistance at the level of 1.3030 and the pair probably will try to approach from it in order to test it again. However, if the pair fails to pass through the level of 1.3030, the market will indicate a bearish opportunity below the new strong resistance level of 1.3030 (the level of 1.3030 coincides with the ratio of 78% Fibonacci). Moreover, the RSI is becoming to signal a downward trend, as the trend is still showing strong above the moving average (100) and (50). Thus, the maket is indicating a bearish opportunity below the 1.3030 level so it will be a good sign to sell at 1.3030 with the first target of 1.2935 to return again with a view to test. It will also call for a downtrend in order to continue towards 1.2935. The daily strong support is seen at 1.2935. It is also worth noting that the price at 1.3030 will possibly form a strong resistance. Accordingly, saturation around 1.3030 to rebound the pair is likely to occur. Furthermore, it is possible that the market is going to start showing the signs of bearish market. Hence, it will be a good sign to sell below 1.3030 with the first target of 1.2900 and continue towards 1.2844 and 1.2805. Analysis of Gold for October 14,.2020 - Rejection of the rising support trendline and potential for test of $1.930 2020-10-14 - The aim is to try to avoid the 'misery' of another national lockdown
He is trying to brush aside the pressure and calls for a 'circuit breaker' lockdown in the UK but if his current approach doesn't bear fruit soon enough, expect the naysayers to hang the virus situation over his head in the coming weeks/months.  Further Development 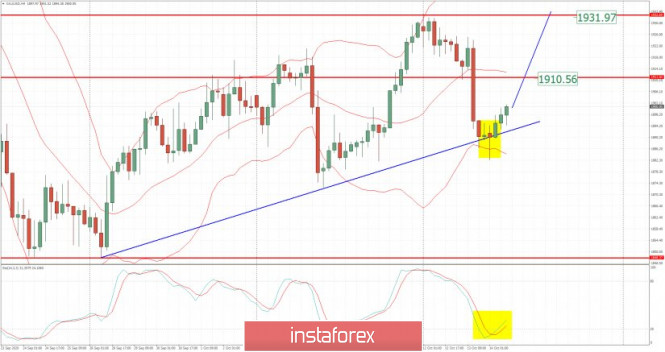
Analyzing the current trading chart of Gold , I found that sellers got exhausted today and that Gold god perfect test and reject from the major upside trendline, which is good confirmation for the further rise. 1-Day relative strength performance Finviz 
Based on the graph above I found that on the top of the list we got Palladium and Silver today and on the bottom Natural Gas and Gasoline RBOB Gold is near the top of the list, which is good sign for the further rise... Key Levels: Resistance: $1,930 Support level: $1,883 EUR/USD analysis for October 14 2020 - Rejection of the median Petchfork trendline and potential for the rise towards 1.1825 2020-10-14 Prior +4.6% - Market index 798.9 vs 804.7 prior
- Purchase index 311.1 vs 316.0 prior
- Refinancing index 3,612.3 vs 3,622.3 prior
- 30-year mortgage rate 3.00% vs 3.01% prior
The long-term mortgage rate falls to a new record low on the survey as the drop in mortgage applications largely stems from a slight moderation in purchase activity. That said, overall purchase levels are still relatively elevated so there isn't any major shift in the recent trend involving the US housing market just yet. Further Development 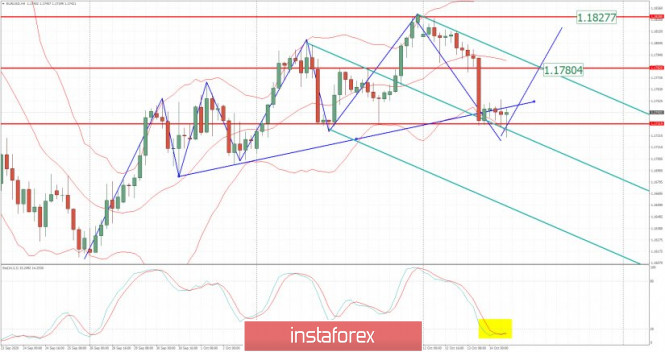
Analyzing the current trading chart of EUR/USD, I found that sellers got exhausted today and that EUR god perfect test and reject from the major support trendline and the medium Pitchfork line, which is good sign for further rise.... Support level is set at the price of 1,1720 The short-mid term trend is still to the upside... Stochastic oscillator is showing oversold condition ... 1-Day relative strength performance Finviz 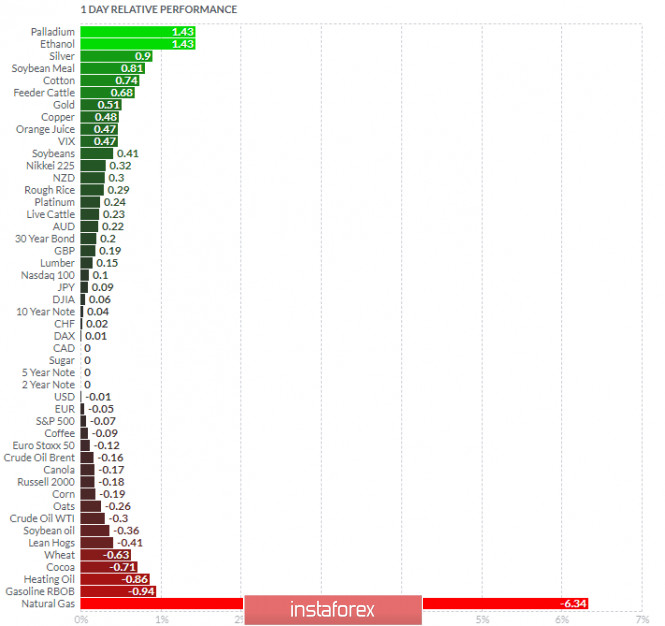
Based on the graph above I found that on the top of the list we got Palladium and Silver today and on the bottom Natural Gas and Gasoline RBOB Key Levels: Resistance: 1,1825 Support level: 1,172 Trading recommendations for the GBP/USD pair on October 14 2020-10-14 Yesterday, the GBP / USD pair consolidated below the psychological level of 1.3000, and had high activity even amid a downward price movement. Its scale is about 53% of the earlier correction, which is the largest price jump during its entire course (1.2674 ---> 1.3081). It's also charged with speculative operations, and this can be seen from the structure of the impulsive wave. However, such an impressive price change still does not give a clear signal for recovery, because in order for it to come to the fore, the quote needs to consolidate lower than 1.2845 in the four-hour time frame. In this case, the price should pass the range 1.2845 / 1.2885, as only such will lead to a surge in short positions, which will increase the chances of reaching a new local low. So, if we look at the M15 chart and analyze the trades set up yesterday, we will see that the wave of short positions appeared at 12: 00-19: 00, during which the quote reached the level of 1.2921. Afterwards, the pound consolidated within the range of 1.2920 / 1.2942. In terms of daily dynamics, October 13 recorded 146 points, which is the highest indicator for 8 trading days and 21% higher than the average level. The surge in activity was due to the abnormal slowdown observed yesterday, where a daily indicator of 77 points was recorded. A similar pattern can also be seen in the EUR / USD pair, where activity also accelerated after a sharp slowdown. Anyhow, as discussed in the previous review , price fluctuations in the range of 1.3000 / 1.3080 were seen by traders as a signal for acceleration, and such really came true in the market. Meanwhile, in the daily chart, it is clear that the correction from 1.2674 was hit by sellers, which in the theory of technical analysis can lead to the end of the movement. A notable point was that the 50.0 Fibonacci level coincided with the accumulation area, which subsequently led to a recovery. With regards to news, data on the UK labor market was published yesterday, but its report was rather weak since the unemployment rate rose from 4.1% to 4.5%. Employment dropped by 153,000 instead of the forecasted 30,000. And perhaps, the only positive news was the jobless claims, which rose by only 28,000 instead of 78,800. In the afternoon, data on US inflation was released, where they recorded a growth from 1.3% to 1.4%. Consumer prices, although did not rise to the forecast level of 1.5%, nevertheless demonstrated a confident recovery, which has a positive effect on the economy and reduces the risks of possible concerns about the prospects of any easing of the Federal Reserve's monetary policy. In terms of the information background, news about COVID-19 and Brexit are still hot topics for speculators. Investors remain concerned about the sharp rise of coronavirus infections in Britain, as its continued acceleration could lead to new strict quarantine measures. About Brexit, everything is stable as of the moment, however, this also means that there are no agreements yet regarding a trade deal.  Today, data on US producer prices will be published, where there may be an increase of 0.4%, which will positively affect the US dollar. In terms of the information background, the UK and the EU will resume Brexit negotiations today, which could arouse activity among speculators in case of any details. Further development As we can see on the trading chart, speculative activity was high in the GBP / USD pair, where during the start of the European session, the quote managed to move above the local low and reached a value of 1.2862. After that, the pair changed direction very abruptly, returning to its previous level. The high activity is probably related to the news that the UK said they will not abandon trade negotiations with the EU. Anyhow, this high activity will persist in the market, so traders should be careful, as chaotic surges may continue because of news on Brexit. And, as mentioned earlier, in order to resume the correction, the pound must consolidate below 1.2845 in the four-hour time frame. 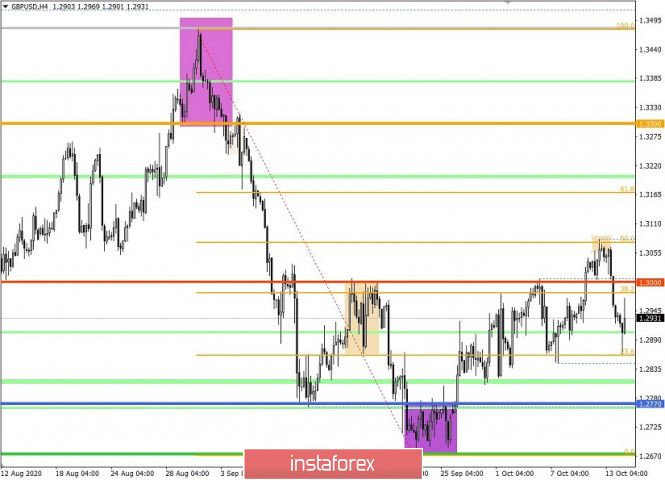 Indicator analysis As we can see on the table, all indicators are indicating different signals, and this is due to the strong information background. They are, at the moment, jumping in the wake of high speculative activity. 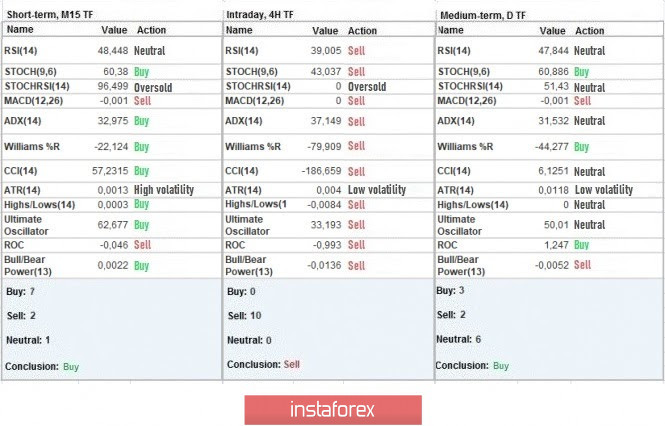 Weekly volatility / Volatility measurement: Month; Quarter; Year Volatility is measured relative to the average daily fluctuations, which are calculated every Month / Quarter / Year. (The dynamics for today is calculated, all while taking into account the time this article is published) Volatility is currently at 107 points, which is already a lot, but perhaps could still increase even further if speculative activity remains high in the market. 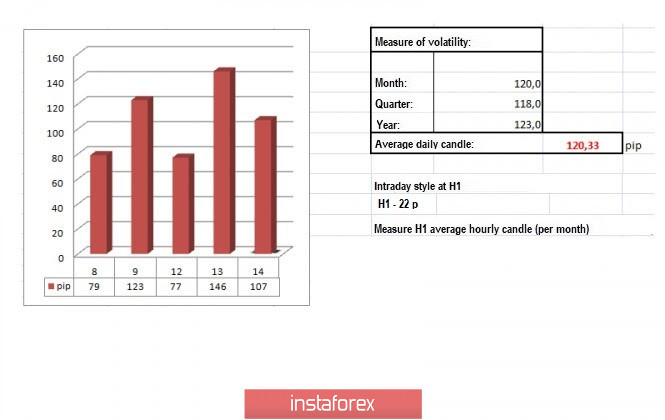 Key levels Resistance zones: 1.3000 ***; 1.3200; 1.3300 **; 1.3600; 1.3850; 1.4000 ***; 1.4350 **. Support Zones: 1.2770 **; 1.2620; 1.2500; 1.2350 **; 1.2250; 1.2150 **; 1.2000 *** (1.1957); 1.1850; 1.1660; 1.1450 (1.1411). * Periodic level ** Range level *** Psychological level Also check the brief trading recommendations for EUR / USD pair here . EUR/USD: plan for the American session on October 14 (analysis of morning deals) 2020-10-14 To open long positions on EURUSD, you need: In the first half of the day, I paid special attention to the formation of a false breakout at 1.1737, as well as to the divergence that can be formed as a result of updating the daily minimum. Let's look at the 5-minute chart and analyze the entry points to the market. A false breakout and a return to 1.1737, along with the divergence of the MACD indicator, led to the formation of a good entry point for long positions. However, the pair did not grow significantly. After that, against the background of a weak report on industrial production in the Eurozone, the bears again returned EUR/USD to the level of 1.1737, trying to form a signal to open short positions from the resistance of 1.1737, which failed. 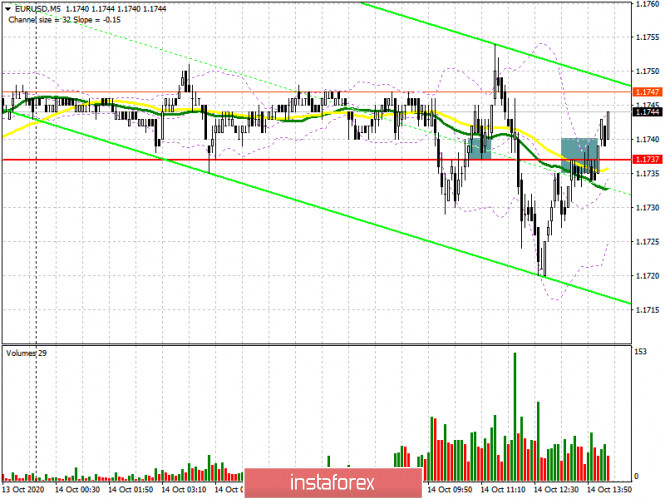
At the moment, the support and resistance levels have changed slightly. Now the focus of buyers is shifted to resistance and consolidation above this level, which forms a good entry point for long positions in the expectation of updating the highs in the area of 1.1789 and 1.1824, where I recommend fixing the profits. If the pressure on the pair returns in the second half of the day, and this may happen after the release of data on US producer prices, there is no need to rush to open long positions from the minimum of 1.1722. It is best to wait for the formation of a false breakout and only then buy the euro. If there is no activity on the part of the bulls, I recommend that you postpone long positions until the minimum of 1.1688 is updated, based on a correction of 20-30 points within the day. To open short positions on EURUSD, you need to: The pressure on the euro has eased, however, this does not mean that buyers have returned to the market. The bears need some time to build up new short positions. The market went down too fast yesterday. The formation of a false breakout in the second half of the day at the level of 1.1756 will be a signal to sell the euro to return to the support area of 1.1722. However, the more important task of the bears will be to break and consolidate below this level, the test of which from the bottom up forms an excellent entry point into short positions to further reduce the euro to the area of the minimum of 1.1688, where I recommend fixing the profits. In the scenario of no bear activity at the level of 1.1756, it is best to postpone sales until the test of a larger resistance of 1.1789, where you can open short positions immediately for a rebound in the expectation of correction of 20-30 points within the day. 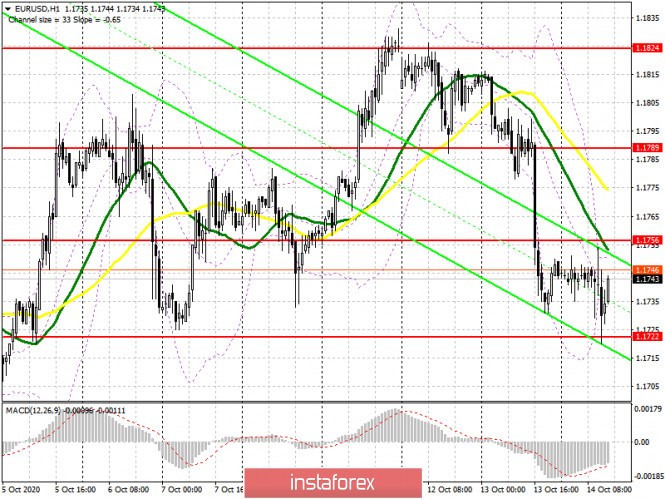
Let me remind you that the COT report (Commitment of Traders) for October 6 recorded a reduction in long positions and an increase in short ones, which led to an even greater decrease in the delta. Buyers of risky assets believe in the continuation of the bull market, but prefer to proceed cautiously, as there is no good news on the Eurozone and the pace of economic recovery yet. Thus, long non-commercial positions decreased from the level of 241,967 to the level of 231,369, while short non-commercial positions increased from the level of 53,851 to the level of 57,061. The total non-commercial net position fell to 174,308, compared to 188,116 a week earlier, which indicates a wait-and-see attitude of new players. However, bullish sentiment for the euro remains quite high in the medium term. Signals of indicators: Moving averages Trading is conducted below 30 and 50 daily moving averages, which keeps the chance of a further decline in the pair. Note: The period and prices of moving averages are considered by the author on the hourly chart H1 and differ from the general definition of classic daily moving averages on the daily chart D1. Only a break of the upper limit of the indicator in the area of 1.1830 will lead to a new wave of growth of the European currency. Description of indicators - Moving average (moving average determines the current trend by smoothing out volatility and noise). Period 50. The graph is marked in yellow.
- Moving average (moving average determines the current trend by smoothing out volatility and noise). Period 30. The graph is marked in green.
- MACD indicator (Moving Average Convergence / Divergence - moving average convergence / divergence) Fast EMA period 12. Slow EMA period 26. SMA period 9
- Bollinger Bands (Bollinger Bands). Period 20
- Non-profit speculative traders, such as individual traders, hedge funds, and large institutions that use the futures market for speculative purposes and meet certain requirements.
- Long non-commercial positions represent the total long open position of non-commercial traders.
- Short non-commercial positions represent the total short open position of non-commercial traders.
- Total non-commercial net position is the difference between the short and long positions of non-commercial traders.
GBP/USD: plan for the American session on October 14 (analysis of morning deals) 2020-10-14 To open long positions on GBP/USD, you need to: In my morning forecast, I recommended selling the British pound after breaking the level of 1.2924, which happened. Let's look at the 5-minute chart and try to figure out what happened. A break of 1.2924 further along the trend at the beginning of the European session led to a fairly large movement of the pound down, which amounted to more than 60 points. However, there were rumors on the market that the EU and the UK are very close on the issues of a trade agreement, which led to a sharp increase of GBP/USD up to the level of 1.2924. Fixing above this range led to the formation of a good entry point into purchases, which is now continuing to be implemented. 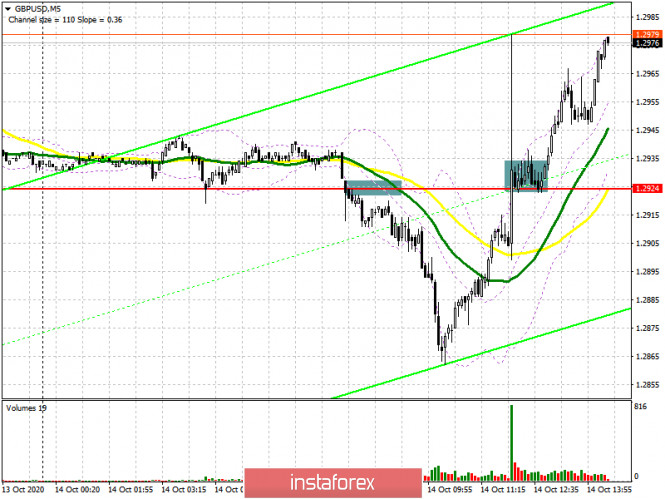
The levels have changed. The nearest target of the bulls is the resistance of 1.3009. However, in the event of a breakout and consolidation at this level, you can continue to buy the pound in the expectation of updating the weekly highs of 1.3065-70, where I recommend fixing the profits. If the rumors remain rumors, and the parties make statements that a consensus could not be found again, do not be surprised by a major drop in the pound. In this scenario, you can only open long positions after forming a false breakout at 1.2939. I recommend buying GBP/USD immediately for a rebound only from the minimum of 1.2865, where the first market reversal took place today. If you re-test this level, you can also expect a bounce up by 20-30 points. To open short positions on GBP/USD, you need: Sellers did everything that was required of them, however, the market did not find a continuation against the background of regular rumors. Now we need official information. Short positions can only be opened after a false breakout is formed in the resistance area of 1.3009, which will lead to a downward correction of GBP/USD to the support area of 1.2939. In the case of negative news on the trade agreement, you can expect a larger decline in GBP/USD to the area of the minimum 1.2865, where I recommend fixing the profits. If the demand for the pound continues in the second half of the day above the level of 1.3009, it is better not to rush with sales, but wait for the update of the maximum of 1.3065, from where you can open short positions immediately for a rebound in the expectation of correction of 30-40 points within the day. 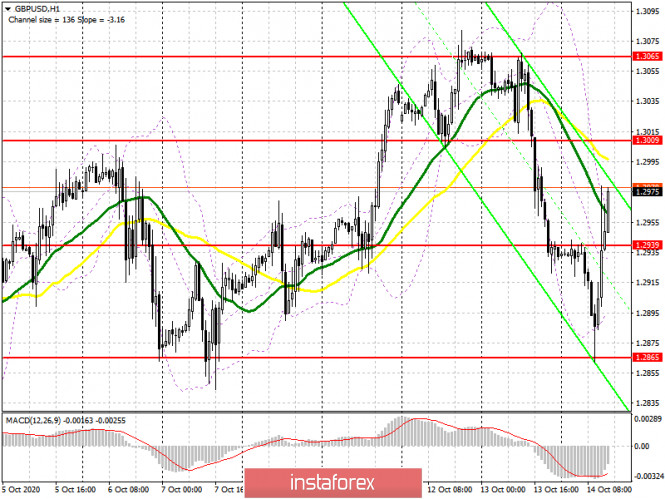
Let me remind you that in the COT reports (Commitment of Traders) for October 6, there was a minimal increase in short non-commercial positions from the level of 51,961 to the level of 51,996. Long non-profit positions slightly increased from the level of 39,216 to the level of 40,698. As a result, the non-commercial net position remained negative and amounted to -11,298, against -12,745, which indicates that sellers of the British pound remain in control and have a minimal advantage in the current situation. The higher the pair grows, the more attractive it will become for sale. Signals of indicators: Moving averages Trading has already returned to the 30 and 50 daily averages, which indicates a possible capitulation of the pound sellers in the near future. Note: The period and prices of moving averages are considered by the author on the hourly chart H1 and differ from the general definition of classic daily moving averages on the daily chart D1. Bollinger Bands If the pair declines, the lower border of the indicator around 1.2885 will provide support. Description of indicators - Moving average (moving average determines the current trend by smoothing out volatility and noise). Period 50. The graph is marked in yellow.
- Moving average (moving average determines the current trend by smoothing out volatility and noise). Period 30. The graph is marked in green.
- MACD indicator (Moving Average Convergence / Divergence - moving average convergence / divergence) Fast EMA period 12. Slow EMA period 26. SMA period 9
- Bollinger Bands (Bollinger Bands). Period 20
- Non-profit speculative traders, such as individual traders, hedge funds, and large institutions that use the futures market for speculative purposes and meet certain requirements.
- Long non-commercial positions represent the total long open position of non-commercial traders.
- Short non-commercial positions represent the total short open position of non-commercial traders.
- Total non-commercial net position is the difference between the short and long positions of non-commercial traders.
Author's today's articles: Igor Kovalyov  Igor Kovalyov was born on September 24, 1985. Igor graduated from Krasnoyarsk State University with a degree in Philology and Journalism. He has a wide experience as a newspaper and information agency correspondent. He got interested in financial markets in 2001. He also graduated from Moscow State University of Economics, Statistics, and Informatics (MESI) with a degree in Global Economics and then served as an analyst in an investment company. He has been working at InstaForex since 2014. Igor Kovalyov was born on September 24, 1985. Igor graduated from Krasnoyarsk State University with a degree in Philology and Journalism. He has a wide experience as a newspaper and information agency correspondent. He got interested in financial markets in 2001. He also graduated from Moscow State University of Economics, Statistics, and Informatics (MESI) with a degree in Global Economics and then served as an analyst in an investment company. He has been working at InstaForex since 2014. Zhizhko Nadezhda  Graduated from Irkutsk State University. Having acquainted with Forex market in 2008, followed the courses in the International Academy of Stock Exchange Trading. The agenda was so exiting that she moved to St. Petersburg in order to get professional education. Obtained a diploma of the retraining course on the discipline Exchange market and stock market issues, defended the graduation paper with distinction on the subject "Modern technical indicators as the basis of the trading system". At the moment obtains a master degree in International Banking Institute on specialty Financial markets and investments. Apart from trading is occupied with development of trading systems and formalization of the working strategies using Ichimoku indicator. At the moment is working on the book dedicated to the peculiarities of Ichimoku indicator and its operating methods. Interests: yoga, literature, travelling and photograph. "You can only get smarter by playing a smarter opponent" Basics of Chess play, 1883 "Successful people change by themselves, the others are changed by life" Jim Rohn Graduated from Irkutsk State University. Having acquainted with Forex market in 2008, followed the courses in the International Academy of Stock Exchange Trading. The agenda was so exiting that she moved to St. Petersburg in order to get professional education. Obtained a diploma of the retraining course on the discipline Exchange market and stock market issues, defended the graduation paper with distinction on the subject "Modern technical indicators as the basis of the trading system". At the moment obtains a master degree in International Banking Institute on specialty Financial markets and investments. Apart from trading is occupied with development of trading systems and formalization of the working strategies using Ichimoku indicator. At the moment is working on the book dedicated to the peculiarities of Ichimoku indicator and its operating methods. Interests: yoga, literature, travelling and photograph. "You can only get smarter by playing a smarter opponent" Basics of Chess play, 1883 "Successful people change by themselves, the others are changed by life" Jim Rohn Pavel Vlasov  No data No data Mourad El Keddani  Was born in Oujda, Morocco. Currently lives in Belgium. In 2003 obtained B.S. in Experimental Sciences. In 2007 obtained a graduate diploma at Institut Marocain Specialise en Informatique Applique (IMSIA), specialty – Software Engineering Analyst. In 2007–2009 worked as teacher of computer services and trainer in a professional school specializing in computer technologies and accounting. In 2005 started Forex trading. Authored articles and analytical reviews on Forex market on Forex websites and forums. Since 2008 performs Forex market research, and develops and implements his own trading strategies of Forex analysis (especially in Forex Research & Analysis, Currency Forecast, and Recommendations and Analysis) that lies in: Numerical analysis: Probabilities, equations and techniques of applying Fibonacci levels. Classical analysis: Breakout strategy and trend indicators. Uses obtained skills to manage traders' accounts since 2009. In April 2009 was certified Financial Technician by the International Federation of Technical Analysts. Winner of several social work awards: Education Literacy and Non-Formal Education (in Literacy and Adult Education in The National Initiative for Human Development). Was born in Oujda, Morocco. Currently lives in Belgium. In 2003 obtained B.S. in Experimental Sciences. In 2007 obtained a graduate diploma at Institut Marocain Specialise en Informatique Applique (IMSIA), specialty – Software Engineering Analyst. In 2007–2009 worked as teacher of computer services and trainer in a professional school specializing in computer technologies and accounting. In 2005 started Forex trading. Authored articles and analytical reviews on Forex market on Forex websites and forums. Since 2008 performs Forex market research, and develops and implements his own trading strategies of Forex analysis (especially in Forex Research & Analysis, Currency Forecast, and Recommendations and Analysis) that lies in: Numerical analysis: Probabilities, equations and techniques of applying Fibonacci levels. Classical analysis: Breakout strategy and trend indicators. Uses obtained skills to manage traders' accounts since 2009. In April 2009 was certified Financial Technician by the International Federation of Technical Analysts. Winner of several social work awards: Education Literacy and Non-Formal Education (in Literacy and Adult Education in The National Initiative for Human Development).
Languages: Arabic, English, French and Dutch.
Interests: Algorithm, Graphics, Social work, Psychology and Philosophy. Petar Jacimovic  Petar was born on July 08, 1989 in Serbia. Graduated from Economy University and after has worked as a currency analyst for large private investors. Petar has been involved in the world of finance since 2007. In this trading he specializes in Volume Price Action (volume background, multi Fibonacci zones, trend channels, supply and demand). He also writes the market analytical reviews for Forex forums and websites. Moreover Petar is forex teacher and has wide experience in tutoring and conducting webinars. Interests : finance, travelling, sports, music "The key to success is hard work" Petar was born on July 08, 1989 in Serbia. Graduated from Economy University and after has worked as a currency analyst for large private investors. Petar has been involved in the world of finance since 2007. In this trading he specializes in Volume Price Action (volume background, multi Fibonacci zones, trend channels, supply and demand). He also writes the market analytical reviews for Forex forums and websites. Moreover Petar is forex teacher and has wide experience in tutoring and conducting webinars. Interests : finance, travelling, sports, music "The key to success is hard work" Vladislav Tukhmenev  Vladislav graduated from Moscow State University of Technologiy and Management. He entered the forex market in early 2008. Vladislav is a professional trader, analyst, and manager. He applies a whole gamut of analysis – technical, graphical, mathematical, fundamental, and candlestick analysis. Moreover, he forecasts the market movements using his own methods based on the chaos theory. Vladimir took part in development of trading systems devoted to fractal analysis. In his free time, Vladimir blogs about exchange markets. Hobbies: active leisure, sporting shooting, cars, design, and marketing. "I do not dream only of becoming the best in my field. I also dream about those who I will take with me along the way up." Vladislav graduated from Moscow State University of Technologiy and Management. He entered the forex market in early 2008. Vladislav is a professional trader, analyst, and manager. He applies a whole gamut of analysis – technical, graphical, mathematical, fundamental, and candlestick analysis. Moreover, he forecasts the market movements using his own methods based on the chaos theory. Vladimir took part in development of trading systems devoted to fractal analysis. In his free time, Vladimir blogs about exchange markets. Hobbies: active leisure, sporting shooting, cars, design, and marketing. "I do not dream only of becoming the best in my field. I also dream about those who I will take with me along the way up." Maxim Magdalinin  In 2005 graduated from the Academy of the Ministry of Internal Affairs of the Republic of Belarus, law faculty. Worked as a lawyer for three years in one of the biggest country's company. Besides the trading, he develops trading systems, writes articles and analytical reviews. Works at stock and commodity markets explorations. On Forex since 2006. In 2005 graduated from the Academy of the Ministry of Internal Affairs of the Republic of Belarus, law faculty. Worked as a lawyer for three years in one of the biggest country's company. Besides the trading, he develops trading systems, writes articles and analytical reviews. Works at stock and commodity markets explorations. On Forex since 2006.
Subscription's options management Theme's:
Fundamental analysis, Fractal analysis, Wave analysis, Technical analysis, Stock Markets
Author's :
A Zotova, Aleksey Almazov, Alexander Dneprovskiy, Alexandr Davidov, Alexandros Yfantis, Andrey Shevchenko, Arief Makmur, Dean Leo, Evgeny Klimov, Fedor Pavlov, Grigory Sokolov, I Belozerov, Igor Kovalyov, Irina Manzenko, Ivan Aleksandrov, l Kolesnikova, Maxim Magdalinin, Mihail Makarov, Mohamed Samy, Mourad El Keddani, Oleg Khmelevskiy, Oscar Ton, Pavel Vlasov, Petar Jacimovic, R Agafonov, S Doronina, Sebastian Seliga, Sergey Belyaev, Sergey Mityukov, Stanislav Polyanskiy, T Strelkova, Torben Melsted, V Isakov, Viktor Vasilevsky, Vladislav Tukhmenev, Vyacheslav Ognev, Yuriy Zaycev, Zhizhko Nadezhda
Edit data of subscription settings
Unsubscribe from the mailing list Sincerely,
Analysts Service | If you have any questions, you can make a phone call using one of the
InstaForex Toll free numbers right now:
|  | InstaForex Group is an international brand providing online trading services to the clients all over the world. InstaForex Group members include regulated companies in Europe, Russia and British Virgin Islands. This letter may contain personal information for access to your InstaForex trading account, so for the purpose of safety it is recommended to delete this data from the history. If you have received this letter by mistake, please contact InstaForex Customer Relations Department. |


No comments:
Post a Comment