| AUD/USD. China's coal front and Australian Non-Farm Payrolls report expectations 2020-10-14 The Australian dollar paired with the US currency is showing a downward trend this week. During the two trading days of this week, the AUD / USD pair lost almost 100 points, falling to the middle of the 71st figure. However, the bears could not overcome the support level of 0.7160 (the average line of the Bollinger Bands indicator coincides with the Tenkan-sen line on the daily chart) and retreated from local lows during the Asian session on Wednesday. At the moment, the pair is displaying a rather sluggish corrective growth. The publication of the consumer confidence index from Westpac (one of the four largest banks in Australia) was the immediate reason behind this correction. This indicator exceeded the forecast estimates, after rising to 105 points. It rose to the highest annual value but due to its secondary importance, this indicator could not become a catalyst for the growth of the Aussie - traders only retreated from the support level and fluttered at the borders of the 72nd figure. 
All in all, the Australian dollar is going through some tough times. Australia and China's rough relationship has resurfaced once again. This time, the Chinese decided to suspend imports of Australian coal. The political conflict between the two countries has long moved to the economic plane - in late spring when China increased duties on some types of Australian goods, while refusing to import beef. In August, the Chinese authorities announced that Australian wines are being sold in China at below-market prices and exports are subsidized. In this regard, the Chinese Ministry of Commerce announced the launch of an anti-dumping investigation. The Australian dollar put up with all these blows from China since they do not have any concern for commodities, which play a strategically important role for the Australian economy. But this time, Beijing decided to raise the stakes: the Chinese authorities issued an unspoken order banning the country's state-owned companies from buying coal in Australia. According to Australian press sources, utility companies and steel mills have been verbally notified to immediately stop importing Australian coal this year. In consequence to this news, the Aussie broke its three-day growth without recoil and collapsed by almost 100 points. Recall that China is the main consumer of coal and the largest importer (about 20% of world imports) in the world. At the same time, Australia is its main supplier. Due to the coronavirus crisis, such decisions by the Chinese look like, figuratively speaking, a "stranglehold." However, this is not the first time Beijing has made such decisions. Australian companies have previously experienced difficulties with the supply of coal to China. The last time this situation occurred was in February last year, when the Chinese authorities delayed customs clearance of goods. But at that time, Australians were the victims of the unofficial system of quotas for coal supplies, which has been used by China since 2018. 
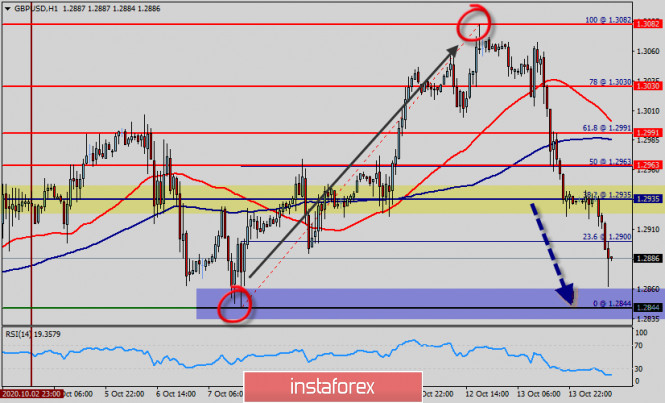
Despite this, many experts urge everyone not to panic. In their perspective, not only does Australia depend on exports to China, but Beijing also depends on better-quality coal and iron ore from Australia. The Chinese, according to the experts, can easily change the supplier of thermal coal for power plants, but it is quite difficult to change the supplier of coking coal for steel plants. Thus, the measures taken by China may be temporary. Judging by the behavior of the Australian dollar, most traders have a similar opinion that the AUD / USD pair has suspended its decline, frozen in anticipation of tomorrow's release. On Thursday, the key data on the Australian labor market will be published. According to preliminary forecasts, tomorrow's release will disappoint investors. So, the unemployment rate in September should rise to 7.1% after a decline to the level of 6.8%. The rate of growth in the number of employees for the first time since May this year is probably going to fall into the negative area. It is predicted by experts that both full-time and part-time employment will decline. The share of the economically active population should also decrease. In conclusion, the Australian will have to go through a difficult test tomorrow. If the announcement is released in the "red zone," then the AUD / USD pair will continue its southern path - up to the base of the 70th figure. A southern impulse for the pair will be provoked by a slowdown in the labor market amid the escalation of the Australian-Chinese political conflict. If the Australian Non-Farm Payrolls report turns out to be better than expected, the Aussie will return to the range of 0.7200-0.7250. Therefore, tomorrow's news release is highly anticipated. Technical Analysis of GBP/USD for October 14, 2020 2020-10-14 Technical Market Outlook: After the local high was made at the level of 1.3081, the GBP/USD pair has reversed all the gains and moved down sharply. The bears has broken below the local technical support located at 1.3017 and 1.2979 and are heading towards the upper main channel line seen around the level of 1.2900. The market is still coming off the overbought levels and the momentum is now negative. The next target for bears is seen at the level of 1.2868 and 1.2848. Weekly Pivot Points: WR3 - 1.3328 WR2 - 1.3191 WR1 - 1.3137 Weekly Pivot - 1.2992 WS1 - 1.2933 WS2 - 1.2792 WS3 - 1.2730 Trading Recommendations: On the GBP/USD pair the main, multi-year trend is down, which can be confirmed by the down candles on the monthly time frame chart. The key long-term technical resistance is still seen at the level of 1.3518. Only if one of these levels is clearly violated, the main trend might reverse (1.3518 is the reversal level) or accelerate towards the key long-term technical support is seen at the level of 1.1903 (1.2589 is the key technical support for this scenario). 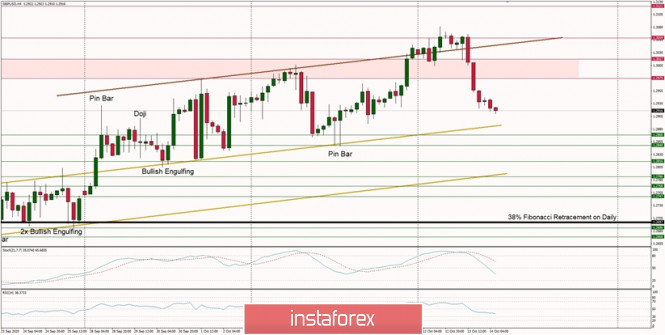
Technical Analysis of EUR/USD for October 14, 2020 2020-10-14 Technical Market Outlook: The EUR/USD pair has hit the level of 1.1822 again, made a new local high at 1.1830 and the reversed all the wave up. This is the 61% Fibonacci retracement level on the weekly time frame chart and had been tested many times in the past and even this time the bears were stronger than bulls again. The market is currently trading at the daily lows around the level of 1.1746. The nearest technical support is seen at the level of 1.1724, 1.1710 and 1.1696. Weak an negative momentum supports the short-term bearish outlook. Weekly Pivot Points: WR3 - 1.2004 WR2 - 1.1916 WR1 - 1.1875 Weekly Pivot - 1.1792 WS1 - 1.1756 WS2 - 1.1665 WS3 - 1.1629 Trading Recommendations: Since the middle of March 2020 the main trend is on EUR/USD pair has been up, which can be confirmed by almost 10 weekly up candles on the weekly time frame chart and 4 monthly up candles on the monthly time frame chart. Nevertheless, weekly chart is recently showing some weakness in form of a several Pin Bar candlestick patterns at the recent top seen at the level of 1.2004. This means any corrections should be used to buy the dips until the key technical support is broken. The key long-term technical support is seen at the level of 1.1445. The key long-term technical resistance is seen at the level of 1.2555. 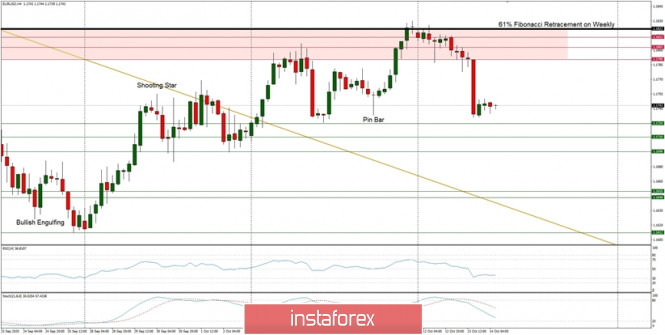
Analytics and trading signals for beginners. How to trade EUR/USD on October 14? Plan for opening and closing trades on Wednesday 2020-10-14 Hourly chart of the EUR/USD pair 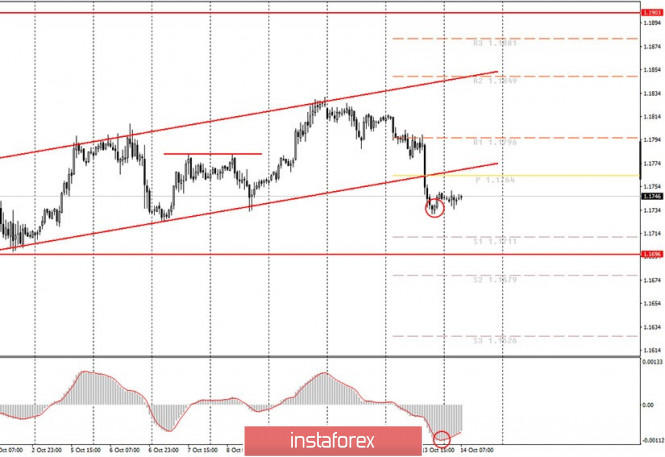 The EUR/USD pair began a weak round of corrective movement last night after it fell by 100 points the day before. Unfortunately, the current size of the correction is not enough to call it a correction in principle, as well as for the MACD indicator to be sufficiently discharged. The indicator is still at its lowest positions, so it will be extremely difficult for it to generate sell signals. This is the specificity of this indicator. Therefore, like last night, we advise beginners to continue waiting for an upward correction to develop and move upward by at least 40-50 points. Not only will such a movement allow us to expect new sell signals, but also a trend line. As for the long-term prospects for the pair's movement, we should not expect it to fall below the $1.16 level in the coming weeks. The problem is that the US dollar has hardly been in demand in recent months. And now - even more so, since the presidential elections in the United States are approaching, and elections are always uncertain. At least in democratic countries. Thus, traders can expect it to fall by another 100-120 points. The fundamental background for the EUR/USD pair remains the same. All the same factors that worked in recent weeks continue to work today. If you look at the higher timeframes (daily, for example), it is obvious that the pair has been trading in a narrow horizontal channel in recent months, no more than 300 points wide. However, we identified a horizontal channel of $1.17-1.19 by even studying the hourly timeframe, which lasted for a long time. European Central Bank President Christine Lagarde is set to deliver another speech in the European Union on Wednesday. However, Lagarde has recently been indulging the markets with her regular speeches, so one should hardly expect any fundamentally new information from her. Moreover, in her last speech, Lagarde considered the possibilities and benefits of creating a digital euro and did not touch on the issues of monetary policy, the economy and the pandemic. Thus, from the point of view of the fundamental background, it is difficult to explain why quotes fell yesterday, and today it is impossible to predict anything. Possible scenarios for October 14: 1) Buy positions on the EUR/USD pair have ceased to be relevant at the moment, since the pair has left the ascending channel and will now form a new downward trend. Thus, in order to consider new long positions, one should wait until new technical patterns appear, such as trend lines or channels, which would support the upward movement. 2) Sell positions have become relevant at the moment. However, following the results of the last few days, the EUR/USD pair lost 100 points in total. Therefore, now we still advise you to wait for an upward correction, as the MACD indicator needs to be discharged after sharply falling to the zero level. At the time of this writing, the price has not gone up enough, therefore, we expect the quotes to grow during the day. You should only open short positions on 1.1711 and 1.1679 after this growth and when the MACD indicator has reversed to the downside. On the chart: Support and Resistance Levels are the Levels that serve as targets when buying or selling the pair. You can place Take Profit near these levels. Red lines are the channels or trend lines that display the current trend and show in which direction it is better to trade now. Up/down arrows show where you should sell or buy after reaching or breaking through particular levels. The MACD indicator (14,22,3) consists of a histogram and a signal line. When they cross, this is a signal to enter the market. It is recommended to use this indicator in combination with trend lines (channels and trend lines). Important announcements and economic reports that you can always find in the news calendar can seriously influence the trajectory of a currency pair. Therefore, at the time of their release, we recommended trading as carefully as possible or exit the market in order to avoid a sharp price reversal. Beginners on Forex should remember that not every single trade has to be profitable. The development of a clear strategy and money management are the key to success in trading over a long period of time. EUR/USD: plan for the European session on October 14. COT reports. Bears are pulling the market over to their side. Aim for support at 1.1737 2020-10-14 To open long positions on EUR/USD, you need: The bears did an excellent job yesterday and went beyond the area below a very large support level, while good US inflation data and a very sharp decline in business sentiment in the eurozone countries only strengthened the demand for the US dollar. The bulls' task for the first half of the day is to prevent a breakout of support at 1.1737, the area where the euro stopped falling yesterday. Forming a false breakout there will be a signal to buy EUR/USD. An additional moment, which will confirm that buyers have returned to the market, is when divergence has formed on the MACD indicator after yesterday's low has been updated. In such a scenario, the buyer should return the euro to the resistance area of 1.1783, where the moving averages are, which is now playing on the side of the sellers. Getting the price to settle at this level will return the market to a bullish position and also lead to updating the weekly high around 1.1824, where I recommend taking profits. In case bulls are not active in the 1.1737 area in the morning, I recommend abandoning long positions until support at 1.1688 has been updated, from which you can buy EUR/USD immediately on a rebound, counting on a correction of 20-30 points within the day. Since we do not expect today's eurozone industrial production data to bring great news, it is best to buy the euro as low as possible from much larger lows. 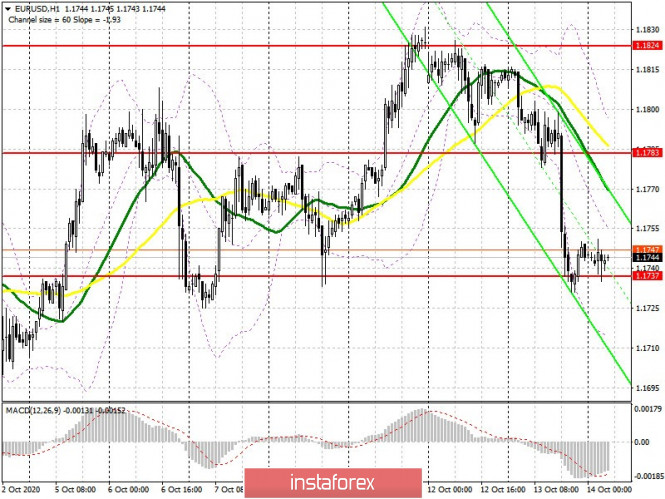 The Commitment of Traders (COT) report for October 6 showed a reduction in long positions and an increase in short positions, which led to an even greater decrease in the delta. Buyers of risky assets believe in sustaining the bull market, but prefer to proceed with caution, as there is no good news about the eurozone and the pace of economic recovery so far. Thus, long non-commercial positions decreased from 241,967 to 231,369, while short non-commercial positions increased from 53,851 to 57,061. The total non-commercial net position decreased to 174,308, against 188,116 a week earlier. which indicates a wait-and-see attitude of new players. However, bullish sentiments for the euro remain rather high in the medium term. To open short positions on EUR/USD, you need: Bears are in control of the market and are set to break support at 1.1737. Most likely, we will still see a downward momentum from the pair, therefore, forming a breakout and settling below 1.1737 along with testing this level from the bottom up forms a good entry point to sell while aiming for the price to fall towards a low of 1.1688. A more distant task for the bears is to update support at 1.1644 at the end of the week, where I recommend taking profits. In case a divergence forms on the MACD indicator and sellers are not active at the 1.1737 level, it is best to postpone short positions until a larger resistance at 1.1783 has been updated, where the upper border of the new descending price channel also passes. It is also possible to sell the euro immediately on a rebound from the week's high in the 1.1824 area with the goal of correcting by 20-30 points within the day. Indicator signals: Moving averages Trading is conducted below 30 and 50 moving averages, which indicates a shift in market sentiment in favor of sellers. Note: The period and prices of moving averages are considered by the author on the H1 hourly chart and differs from the general definition of the classic daily moving averages on the D1 daily chart. Bollinger Bands If the pair grows, the movement will be limited by the upper border of the indicator around 1.1790. The first test of the lower border of the indicator in the 1.1715 area may limit the pressure on the euro, but its break will lead to a larger sale. Description of indicators - Moving average (moving average, determines the current trend by smoothing out volatility and noise). Period 50. It is marked in yellow on the chart.
- Moving average (moving average, determines the current trend by smoothing out volatility and noise). Period 30. It is marked in green on the chart.
- MACD indicator (Moving Average Convergence/Divergence — convergence/divergence of moving averages) Quick EMA period 12. Slow EMA period to 26. SMA period 9
- Bollinger Bands (Bollinger Bands). Period 20
- Non-commercial speculative traders, such as individual traders, hedge funds, and large institutions that use the futures market for speculative purposes and meet certain requirements.
- Long non-commercial positions represent the total long open position of non-commercial traders.
- Short non-commercial positions represent the total short open position of non-commercial traders.
- Total non-commercial net position is the difference between short and long positions of non-commercial traders.
GBP/USD: plan for the European session on October 14. COT reports. Buyers of the pound could not withstand the pressure from the negative news 2020-10-14 To open long positions on GBP/USD, you need: Buyers of the pound could not withstand the pressure from negative news, which are published almost daily in the UK. And so they retreated under the pressure of sellers, which led to a breakthrough of a rather important support level. The sharp rise in the unemployment rate, even with all the support measures provided by the government, is an extremely bad sign for the economic outlook in the UK. Hope for a trade deal is clearly not enough to keep the British pound at current highs. The bulls currently need to defend support at 1.2924, since a lot depends on this level. It is unlikely for us to count on a divergence in these conditions, therefore, only a false breakout in the 1.2924 area can produce the first signal to buy the British pound. An equally important task will be to return resistance at 1.2991, where the moving averages are, which is playing on the side of the pound sellers. Settling above this range will open a direct way for the pound to reach the weekly high of 1.3056, where I recommend taking profits. In case GBP/USD falls further, and bulls are not active at the 1.2924 level, and this is more likely, it is better not to rush to buy, but to wait for an update on the next low in the 1.2848 area and then you can buy the pound there immediately on a rebound, counting on a 30-40 points within the day. 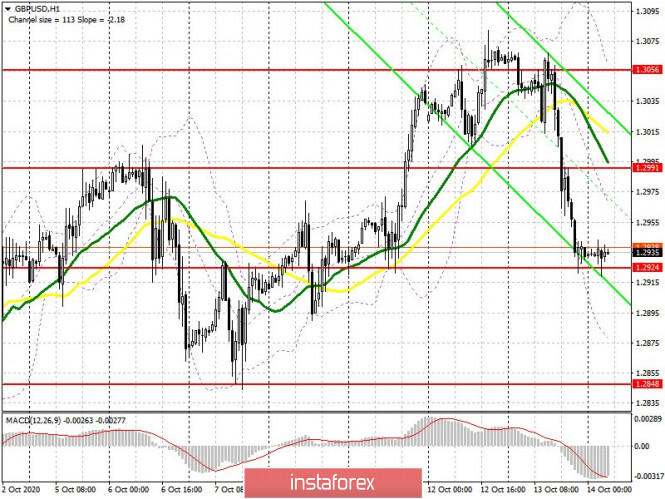 The Commitment of Traders (COT) report for October 6 showed a minimal increase in short non-commercial positions from 51,961 to 51,996. Long non-commercial positions slightly rose from 39,216 to 40,698. As a result, non-commercial net position remained negative and reached -11,298 against -12,745, which indicates that sellers of the pound retain control and also shows their slight advantage in the current situation. The higher the pair grows, the more attractive it is to sell. To open short positions on GBP/USD, you need: Sellers still have the market under their control, but in order for bulls to completely surrender, we need a breakout and have the pair settle below support at 1.2924 by today. Testing this level from the bottom up in the first half of the day forms a good entry point for short positions in order for the downward trend to continue falling to the support area of 1.2848. The long term goal at the end of the week will be lows of 1.2807 and 1.2749, where I recommend taking profits. There is no need to rush to sell in case the pair recovers in the European session. The optimal scenario for entering short positions is when a false breakout has formed in the resistance area of 1.2991. You can sell the pound immediately on a rebound from the weekly resistance of 1.3056, counting on a correction of 30-40 points within the day. Indicator signals: Moving averages Trading is carried out below 30 and 50 moving averages, which indicates a gradual return of the market under the bears' control. Note: The period and prices of moving averages are considered by the author on the H1 hourly chart and differs from the general definition of the classic daily moving averages on the D1 daily chart. Bollinger Bands If the pair grows, the upper border of the indicator at 1.3055 will act as resistance. The pair will be supported by the lower border of the indicator in the 1.2875 area. Description of indicators - Moving average (moving average, determines the current trend by smoothing out volatility and noise). Period 50. It is marked in yellow on the chart.
- Moving average (moving average, determines the current trend by smoothing out volatility and noise). Period 30. It is marked in green on the chart.
- MACD indicator (Moving Average Convergence/Divergence — convergence/divergence of moving averages) Quick EMA period 12. Slow EMA period to 26. SMA period 9
- Bollinger Bands (Bollinger Bands). Period 20
- Non-commercial speculative traders, such as individual traders, hedge funds, and large institutions that use the futures market for speculative purposes and meet certain requirements.
- Long non-commercial positions represent the total long open position of non-commercial traders.
- Short non-commercial positions represent the total short open position of non-commercial traders.
- Total non-commercial net position is the difference between short and long positions of non-commercial traders.
Trading plan for the EUR/USD pair on October 14. Second pandemic wave in Europe. 2020-10-14 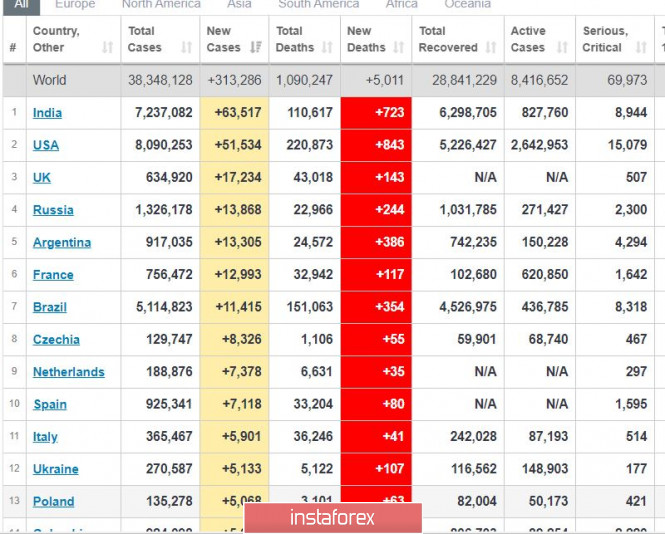
The situation is persistently turning bad in Europe, as many states continue to record high levels of incidence rate with coronavirus. The most notable of which is the United Kingdom, which recorded 17 thousand new cases, followed by France, which listed around 13 thousand. Meanwhile, the Czech Republic, Holland, Spain, Italy, Poland and Ukraine all recorded more than 5 thousand new infections per day. 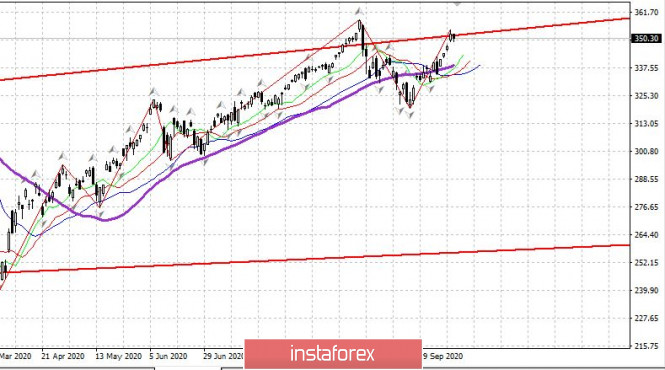
US stocks are set to remain in a bull market for a long period of time, undoubtedly repeating all the highs recorded last September. Nonetheless, sales can still be made, but as long as it has a small stop. 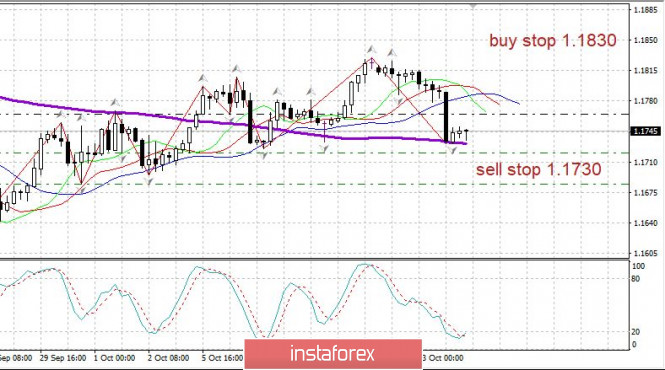
EUR/USD: The euro dropped sharply yesterday, halting its upward impulsive wave. Regardless, its further direction is still unclear, so perhaps, the upcoming Beige Book report of the Fed will determine what movement it will take. Set up short positions from 1.1730 or 1.1720, and then place stop loss at about 45 pips. Open long positions from 1.1830. Brief trading recommendations for EUR/USD on 10/14/20 2020-10-14 
Yesterday, the EUR/USD pair successfully showed an increased activity, where the recent stagnation area located at 1.1800/1.1830 served as a resistance. The downward movement and the strength of the course was an expected phenomenon based on a number of natural facts listed below: - Systematic interaction of trading forces within the price level of 1.1810. - A sharp activity slowdown on October 12. The daily dynamics was only 39 points, which was considered unusually low. From the point of view of technical analysis, these are direct trading signals that the market can reverse as well as accelerate. From the point of view of fundamental analysis, the news on US inflation was in favor of the strengthening of the US dollar, which was reflected in its growth – from 1.3% to 1.4%. Relative to the current location of the quote, you can see another logical basis associated with price levels. So, during the period of sharp decline, market participants came to the area of 1.1725/1.1750, where there was a natural stop in the market last October 7 and 8. And unlike the price area of 1.1800/1.1830, the range of 1.1725/1.1750 is not very important, which means that the chance of its breakdown in the downward direction is quite high. Based on the location of the quote and the behavior of market participants, it is possible to make a forecast from several possible market development scenarios. First, a breakdown. As mentioned earlier, the area of 1.1725/1.1750 is not very important, which means that there is a chance of a breakout in the market. In this case, you should see the price consolidating below 1.1725, which will indicate a local movement towards 1.1700-1.1695. Second, a prolonged stagnation. Market participants refrain within 1.1725/1.1750, which led the speculative transactions to form. In this case, the trading tactic follows a simple method – breaking the established borders, in our case, the range of 1.1725/1.1750. In the first version, it was a breakdown of the lower border, but now it is a breakdown of the upper border. Price consolidation above the level of 1.1755 leads to a local movement towards 1.1755. 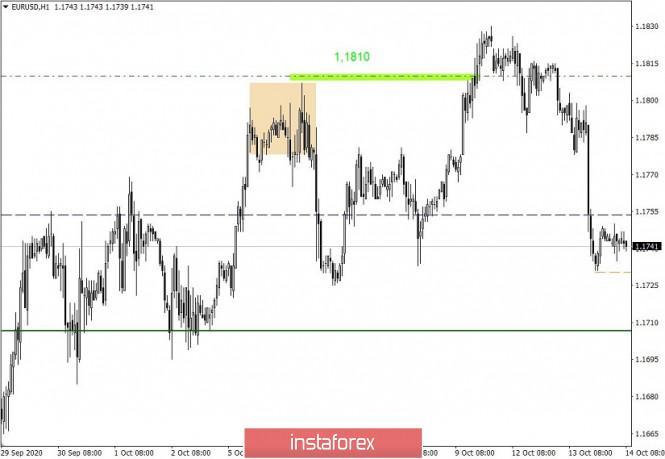
Indicator Analysis. Daily review for the GBP/USD currency pair 10/14/20 2020-10-14 Trend analysis (Fig. 1). Today, the market will try to continue moving down from the level of 1.2937 (closing of yesterday's daily candle) in order to reach the support line of 1.2814 (red bold line). If this line will be tested, a further work up to the target of 1.2983 will have a pullback level of 38.2% (blue dotted line). 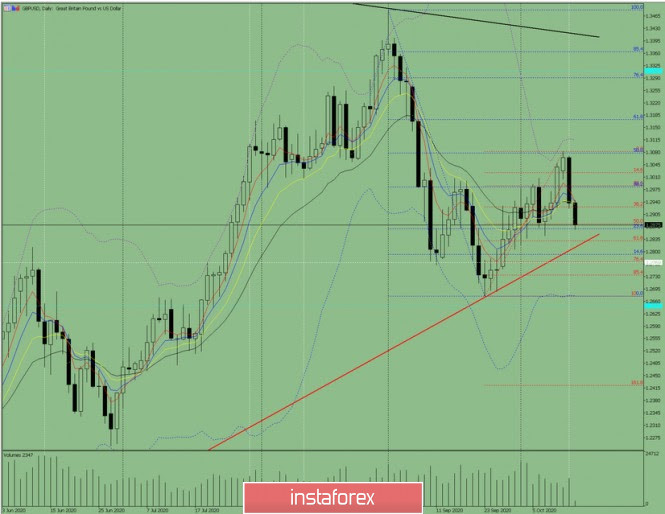 Figure 1 (daily chart). Complex Analysis: - Indicator Analysis – Down
- Fibonacci Levels – Down
- Technical Analysis – Down
General conclusion: Today, the price from the level of 1.2937 (closing yesterday's daily candle) will try to continue moving down to reach the support line of 1.2814 (red bold line). If this line will be tested, a further work up will have a target of 1.2983 with a pullback level of 38.2% (blue dotted line). Alternative scenario: the price from the level of 1.2937 (closing of yesterday's daily candle) will try to continue moving down with the goal of reaching the 50% pullback level – 1.2878 (red dotted line). In the case of testing this level, further work up will have a target of 1.2982 that will roll back to the level of 38.2% (blue dotted line). Don't buy in EUR/USD before this level! 2020-10-14  A strong bearish momentum went through the euro yesterday, so as a result, the quote reached the round level of 1.17. 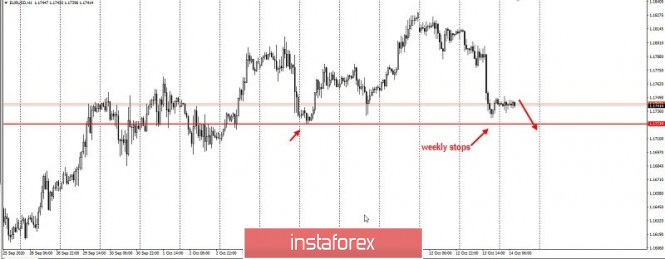 This means that traders who have opened long positions in the pair earlier have fallen into the trap and are now only below the levels 1.17200 and 17.0000. Anyhow, if you want to trade in the direction of yesterday's initiative, you can do it cost-effectively through a pullback as presented below: 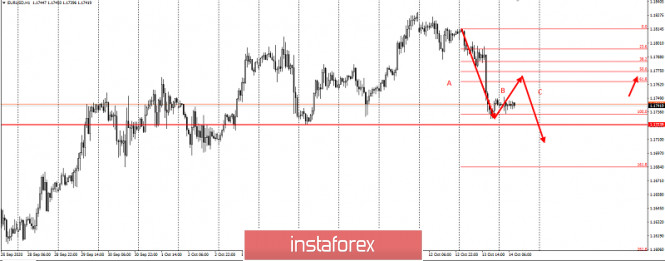 With the current bearish thrust, draw a 50% retracement zone. Such could give profit, about 1 to 1. Of course, you still have to monitor the risks to avoid any losses. Remember that trading in this market is precarious, and will only be profitable if you use the right strategy or approach. Good luck! Who's at the top: Gold, Biden, or Trump? 2020-10-14 
Like the US dollar, gold has become a victim to the upcoming US presidential elections, as its further dynamics strongly depend on their outcome. The high probability of victory for Democrat Joe Biden, Trump's main rival, is a key role in this issue. Experts from Standard Chartered investment bank believe that if Joe Biden wins, the price of gold will soar to new peaks. Donald Trump's main competitor is ready to support the next package of fiscal stimulus measures, and due to which gold will receive additional support. Analysts believe that its victory will be a good signal to further ease Fed's monetary policy. It should be noted that the financial aid package from the US Democratic Party is much higher than that of the Republican Party, to which D. Trump belongs. If another scenario is implemented, namely, D. Trump retains his power, the gold may slightly decline, but it will not lose its attractiveness for investors. It is still in demand as a "safe haven", which is not afraid of any turbulence. Periodically, gold slightly loses its position, but it gains height again after a while. Yesterday, gold's price reached $1915 per 1 ounce, but then it slowed down. Today, gold was found trading at $1896–$1897 per 1 ounce, finding its way back to the upward trend. 
Experts explain that the short-term decline of gold is caused by the dollar's strengthening. Gold's eternal rival has been strengthening its position since the beginning of August 2020. This was not prevented even by the impressive budget deficit in the United States caused by huge expenditures due to the COVID-19 pandemic, a powerful recession and unemployment rate. So as the dollar rose, gold slightly declined. Nevertheless, experts are confident that it will be able to catch up in the near future. Moreover, Standard Chartered believes that the price of gold will increase to $ 2,100 per ounce in the first quarter of 2021. If the Republican candidates win the elections, the growth of gold will stop. On the contrary, if the Democrats lead, it will give impulse to the dynamics of gold. At the same time, experts warn that the victory of the US Democratic Party threatens the further growth of the US currency. Analyzing the previous presidential elections in America, experts concluded that the high level of uncertainty about the winner helps the growth of "gold" quotes. The chances of a further rise in gold increase as the pre-election situation deepens, in which it is difficult to distinguish the future US President. At the same time, each subsequent correction in the precious metals market provides investors with an excellent opportunity to increase their positions in gold. Experts are sure that gold's price will rise in the short and medium-term. This is supported by negative interest rates, rise in the quantitative easing (QE) program and the weakening of the US currency. Technical analysis of GBP/USD for October 14, 2020 2020-10-14 Technical analysis of EUR/USD for October 14, 2020 2020-10-14 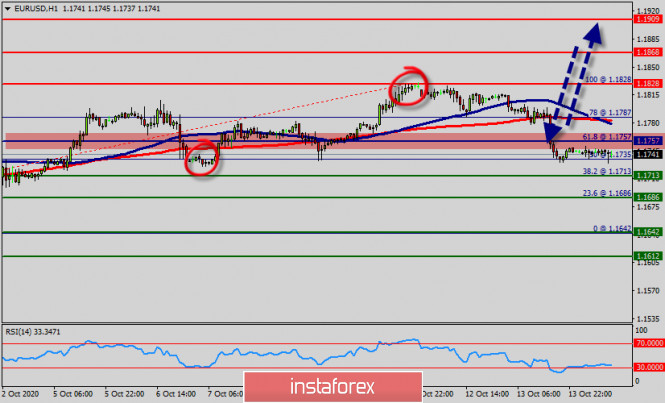 Overview : The EUR/USD pair sets on major support right now for that we remain bullish. Price is starting to bounce nicely off our major support area starting from 1.1740. The EUR/USD pair moved higher and closed the day in positive area around the 1.1740-1.1757 levels. The EUR/USD pair will probably continue to rise from the level of 1.1740-1.1757 in the long term. It should be noted that the support is established at the level of 1.1757 which represents the 61.8% Fibonacci retracement level on the H1 chart. The price (1.1757) is likely to form a double bottom in the same time frame. Accordingly, the EUR/USD pair is showing signs of strength following a breakout of the highest level of 1.1740-1.1757. We expect to see a strong reaction off this level to push price up towards 1.1828 before 1.1757 support. RSI (14) sees a bullish way out of our ascending support-turned-resistance line signalling that we'll likely be seeing some bearish momentum between the levels of 1.1828 - 1.1757. This suggests the pair will possibly go up in coming hours. A daily closure above .1828 allows the pair to make a quick bullish movement towards the next resistance level around 1.1868. However, traders should watch for any signs of bearish rejection that occur around 1.1828 - 1.1755. The pivot point stands at 1.1755. The pair is trading above its pivot point. It is likely to trade in a higher range as long as it remains above the pivot point. Long positions are recommended with the first target at 1.1868. A break of that target will move the pair further downwards to 1.1909. Today, the price is in a bearish channel now as long as the trend is still set above the spot of 1.1755. Amid the previous events, the pair is still in an uptrend. The EUR/USD pair is continuing in a bullish trend from the new support of 1.1755. Buy above the level of 1.1757 with the first target at 1.1868 in order to test the daily resistance 1 and further to 1.1909. Also, it might be noted that the level of 1.1909 is a good place to take profit because it will form a new double top. On the other hand, in case a reversal takes place and the EUR/USD pair breaks through the support level of 1.1757, a further decline to 1.1642 can occur which would indicate a bearish market. Trading idea for USD/CHF 2020-10-14  The dollar jumped up during the US trading session yesterday, so as a result, the USD / CHF pair closed with a bullish engulfing pattern. If you can recall the strategy we presented on October 5 , we have already tried to increase the quote from a 50% bullish daily impulse. However, we dropped it the day after. But now, I would like to suggest again this strategy, as I'm betting on a continued rise of the USD / CHF pair in the market. 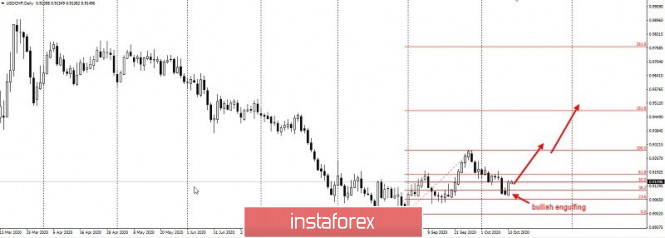 In fact, a strong three-wave pattern has already formed in the daily chart, with which wave A is the initiative seen last September. As of the moment, the market is standing at half of this initiative, and has the potential of moving upwards, towards price levels 0.63 and 0.94. However, this bullish idea will be canceled if the quote drops below 0.905. Nonetheless, the profitability of this approach is 2 to 1. Good luck!
Author's today's articles: Irina Manzenko  Irina Manzenko Irina Manzenko Sebastian Seliga  Sebastian Seliga was born on 13th Oсtober 1978 in Poland. He graduated in 2005 with MA in Social Psychology. He has worked for leading financial companies in Poland where he actively traded on NYSE, AMEX and NASDAQ exchanges. Sebastian started Forex trading in 2009 and mastered Elliott Wave Principle approach to the markets by developing and implementing his own trading strategies of Forex analysis. Since 2012, he has been writing analitical reviews based on EWP for blogs and for Forex websites and forums. He has developed several on-line projects devoted to Forex trading and investments. He is interested in slow cooking, stand-up comedy, guitar playing, reading and swimming. "Every battle is won before it is ever fought", Sun Tzu Sebastian Seliga was born on 13th Oсtober 1978 in Poland. He graduated in 2005 with MA in Social Psychology. He has worked for leading financial companies in Poland where he actively traded on NYSE, AMEX and NASDAQ exchanges. Sebastian started Forex trading in 2009 and mastered Elliott Wave Principle approach to the markets by developing and implementing his own trading strategies of Forex analysis. Since 2012, he has been writing analitical reviews based on EWP for blogs and for Forex websites and forums. He has developed several on-line projects devoted to Forex trading and investments. He is interested in slow cooking, stand-up comedy, guitar playing, reading and swimming. "Every battle is won before it is ever fought", Sun Tzu Stanislav Polyanskiy  Graduated from Odessa State Economic University. On Forex since 2006. Writes analytical reviews about international financial markets for more than 3 years. Worked as a currency analyst in different finance companies for a long time including the biggest companies of Russia and Ukraine. Graduated from Odessa State Economic University. On Forex since 2006. Writes analytical reviews about international financial markets for more than 3 years. Worked as a currency analyst in different finance companies for a long time including the biggest companies of Russia and Ukraine. Maxim Magdalinin  In 2005 graduated from the Academy of the Ministry of Internal Affairs of the Republic of Belarus, law faculty. Worked as a lawyer for three years in one of the biggest country's company. Besides the trading, he develops trading systems, writes articles and analytical reviews. Works at stock and commodity markets explorations. On Forex since 2006. In 2005 graduated from the Academy of the Ministry of Internal Affairs of the Republic of Belarus, law faculty. Worked as a lawyer for three years in one of the biggest country's company. Besides the trading, he develops trading systems, writes articles and analytical reviews. Works at stock and commodity markets explorations. On Forex since 2006. Mihail Makarov  - - Vladislav Tukhmenev  Vladislav graduated from Moscow State University of Technologiy and Management. He entered the forex market in early 2008. Vladislav is a professional trader, analyst, and manager. He applies a whole gamut of analysis – technical, graphical, mathematical, fundamental, and candlestick analysis. Moreover, he forecasts the market movements using his own methods based on the chaos theory. Vladimir took part in development of trading systems devoted to fractal analysis. In his free time, Vladimir blogs about exchange markets. Hobbies: active leisure, sporting shooting, cars, design, and marketing. "I do not dream only of becoming the best in my field. I also dream about those who I will take with me along the way up." Vladislav graduated from Moscow State University of Technologiy and Management. He entered the forex market in early 2008. Vladislav is a professional trader, analyst, and manager. He applies a whole gamut of analysis – technical, graphical, mathematical, fundamental, and candlestick analysis. Moreover, he forecasts the market movements using his own methods based on the chaos theory. Vladimir took part in development of trading systems devoted to fractal analysis. In his free time, Vladimir blogs about exchange markets. Hobbies: active leisure, sporting shooting, cars, design, and marketing. "I do not dream only of becoming the best in my field. I also dream about those who I will take with me along the way up." Sergey Belyaev  Born December 1, 1955. In 1993 graduated from Air Force Engineering Academy. In September 1999 started to study Forex markets. Since 2002 has been reading lectures on the technical analysis . Is fond of research work. Created a personal trading system based on the indicator analysis. Authored the book on technical analysis "Calculation of the next candlestick". At present the next book is being prepared for publishing "Indicator Analysis of Forex Market. Trading System Encyclopedia". Has created eleven courses on indicator analysis. Uses classical indicators. Works as a public lecturer. Held numerous seminars and workshops presented at international exhibitions of financial markets industry. Is known as one of the best specialists in the Russian Federation researching indicator analysis. Born December 1, 1955. In 1993 graduated from Air Force Engineering Academy. In September 1999 started to study Forex markets. Since 2002 has been reading lectures on the technical analysis . Is fond of research work. Created a personal trading system based on the indicator analysis. Authored the book on technical analysis "Calculation of the next candlestick". At present the next book is being prepared for publishing "Indicator Analysis of Forex Market. Trading System Encyclopedia". Has created eleven courses on indicator analysis. Uses classical indicators. Works as a public lecturer. Held numerous seminars and workshops presented at international exhibitions of financial markets industry. Is known as one of the best specialists in the Russian Federation researching indicator analysis. Andrey Shevchenko  Andrey Shevchenko Andrey Shevchenko l Kolesnikova  text text Mourad El Keddani  Was born in Oujda, Morocco. Currently lives in Belgium. In 2003 obtained B.S. in Experimental Sciences. In 2007 obtained a graduate diploma at Institut Marocain Specialise en Informatique Applique (IMSIA), specialty – Software Engineering Analyst. In 2007–2009 worked as teacher of computer services and trainer in a professional school specializing in computer technologies and accounting. In 2005 started Forex trading. Authored articles and analytical reviews on Forex market on Forex websites and forums. Since 2008 performs Forex market research, and develops and implements his own trading strategies of Forex analysis (especially in Forex Research & Analysis, Currency Forecast, and Recommendations and Analysis) that lies in: Numerical analysis: Probabilities, equations and techniques of applying Fibonacci levels. Classical analysis: Breakout strategy and trend indicators. Uses obtained skills to manage traders' accounts since 2009. In April 2009 was certified Financial Technician by the International Federation of Technical Analysts. Winner of several social work awards: Education Literacy and Non-Formal Education (in Literacy and Adult Education in The National Initiative for Human Development). Was born in Oujda, Morocco. Currently lives in Belgium. In 2003 obtained B.S. in Experimental Sciences. In 2007 obtained a graduate diploma at Institut Marocain Specialise en Informatique Applique (IMSIA), specialty – Software Engineering Analyst. In 2007–2009 worked as teacher of computer services and trainer in a professional school specializing in computer technologies and accounting. In 2005 started Forex trading. Authored articles and analytical reviews on Forex market on Forex websites and forums. Since 2008 performs Forex market research, and develops and implements his own trading strategies of Forex analysis (especially in Forex Research & Analysis, Currency Forecast, and Recommendations and Analysis) that lies in: Numerical analysis: Probabilities, equations and techniques of applying Fibonacci levels. Classical analysis: Breakout strategy and trend indicators. Uses obtained skills to manage traders' accounts since 2009. In April 2009 was certified Financial Technician by the International Federation of Technical Analysts. Winner of several social work awards: Education Literacy and Non-Formal Education (in Literacy and Adult Education in The National Initiative for Human Development).
Languages: Arabic, English, French and Dutch.
Interests: Algorithm, Graphics, Social work, Psychology and Philosophy.
Subscription's options management Theme's:
Fundamental analysis, Fractal analysis, Wave analysis, Technical analysis, Stock Markets
Author's :
A Zotova, Aleksey Almazov, Alexander Dneprovskiy, Alexandr Davidov, Alexandros Yfantis, Andrey Shevchenko, Arief Makmur, Dean Leo, Evgeny Klimov, Fedor Pavlov, Grigory Sokolov, I Belozerov, Igor Kovalyov, Irina Manzenko, Ivan Aleksandrov, l Kolesnikova, Maxim Magdalinin, Mihail Makarov, Mohamed Samy, Mourad El Keddani, Oleg Khmelevskiy, Oscar Ton, Pavel Vlasov, Petar Jacimovic, R Agafonov, S Doronina, Sebastian Seliga, Sergey Belyaev, Sergey Mityukov, Stanislav Polyanskiy, T Strelkova, Torben Melsted, V Isakov, Viktor Vasilevsky, Vladislav Tukhmenev, Vyacheslav Ognev, Yuriy Zaycev, Zhizhko Nadezhda
Edit data of subscription settings
Unsubscribe from the mailing list Sincerely,
Analysts Service | If you have any questions, you can make a phone call using one of the
InstaForex Toll free numbers right now:
|  | InstaForex Group is an international brand providing online trading services to the clients all over the world. InstaForex Group members include regulated companies in Europe, Russia and British Virgin Islands. This letter may contain personal information for access to your InstaForex trading account, so for the purpose of safety it is recommended to delete this data from the history. If you have received this letter by mistake, please contact InstaForex Customer Relations Department. |


No comments:
Post a Comment