| EUR/USD. US dollar is unfavorable again 2020-12-29 The euro/dollar pair is approaching the price highs this year amid a narrow market and an almost empty economic calendar. Here, general political fundamental factors establish the mood for trading, which determine the level of market interest in anti-risk or, on the contrary, risky assets. The US dollar, as the main protective instrument, depends on traders' degree of nervousness. As an example, the indicated currency was in high demand last week amid high-profile events around Brexit. Following the signing of the historic deal, traders began to take profits, which is why the dollar's position strengthened again throughout the market. 
However, the situation has changed this week. The overall fundamental background is mostly positive, while the interest in protective assets has declined markedly. In conditions of low liquidity, traders favor the euro, slowly getting rid of the US currency. The news flow is still contributing to the growth of EUR/USD. If we talk about American events, then it is necessary to highlight several news feeds. First, Donald Trump signed a stimulus package yesterday to support the US economy with a total volume of $ 900 billion, previously approved by Congress. Earlier, he intended to return the bill without a signature to Congressmen, calling the proposed document a disgrace. The President was outraged by the amount of the one-time subsidy. The compromise bill includes $ 600 in aid to those Americans affected by the pandemic. This amount is half as much as in the first stimulus package, so the head of the White House called it ridiculously low and demanded that it be increased to two thousand dollars. Last Friday, Trump voiced his outrage, allowing dollar bulls to show character again. However, this fundamental factor was only temporary. Despite his threats, the President did not veto the bill and signed it without any additional comments. In addition, he lost another battle on the legislative field yesterday. The House of Representatives of the Congress overcame the president's veto, approving the country's draft defense budget for next year twice. Out of 435 members of the House of Representatives, 322 congressmen voted for overcoming the presidential blocking, while 87 were against it. It should be noted that the Democrats have 233 mandates in the Lower House of Congress, that is, many Republicans voted against the presidential decision. Many experts believe that the Senate will similarly overcome Donald Trump's veto. This fundamental factor is quite symbolic in the currency market. According to experts, the current re-vote with overcoming the veto is the first during Trump's presidency (although he has blocked bills nine times over the past 4 years). Amid his threatening statements, the currency market participants positively received the unanimity of congressmen. Anti-risk sentiment declined again, so the US dollar was hit by a wave of sales again. The euro/dollar pair, in turn, is heading to this year's high, which is located at 1.2277. 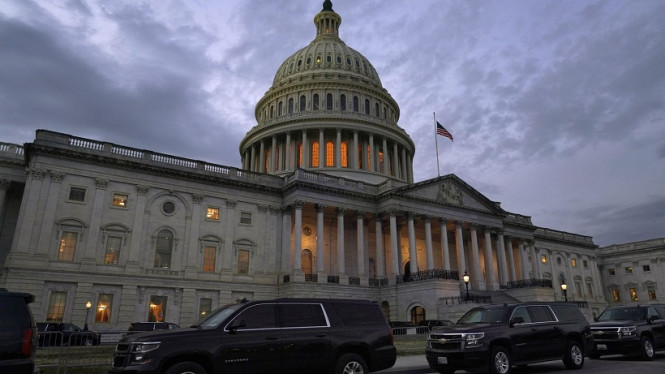
On the other hand, European events also contribute to the growth of the EUR/USD pair. In particular, the EU permanent representatives unanimously approved the temporary application of the trade and cooperation agreement between the EU and the UK yesterday. It should be recalled that the European Parliament failed to ratify last week's trade deal between London and Brussels this year. Therefore, the European side agreed to apply a special legal mechanism that would allow the agreement to be implemented as early as January 1, 2021, that is, before the ratification by the European Parliament. Tomorrow, December 30, the British Parliament is expected to approve the deal. Most experts agree that this procedure is just for formality, since most of the Conservative MPs are supporters of Boris Johnson. The deal will most certainly be approved, even considering the internal opposition. The leading political observers are convinced of this. The so-called "coronavirus factor" also provides indirect support to the euro. In particular, the focus is on the measures taken to combat the pandemic. On December 27, the EU countries began a campaign for a large-scale vaccination against COVID-19. This resulted in millions of doses of drugs beginning to arrive in the largest logistics centers of the EU. Countries in the EU such as Hungary, Germany and Slovakia have started vaccination. Spain and Bulgaria started vaccinating people as well last December 27, while Belgium and Luxembourg started from December 28. In turn, the Netherlands will start from January 8. Amid such trends, EUR/USD traders became optimistic, and this fact allowed the pair's buyers to develop an upward offensive. There is no doubt that any trading decisions made in the pre-New Year week are associated with risk – the market sometimes behaves inadequately in conditions of low liquidity and profit-taking. But in general, the fundamental outlook is in favor of the euro, that is, in favor of long positions on the EUR/USD pair. In the short term, we can talk about reaching the resistance level of 1.2277 (two and a half year high reached during the third week of December). The main upward target is the round level of 1.2300 – the upper line of the Bollinger Bands indicator on the daily time frame. Trading idea for the USD/JPY pair 2020-12-29 
A very interesting situation is developing in the USD / JPY pair today. Sellers are trapped below 103.9, which suggests that traders could open long positions in order to increase the price of the pair. 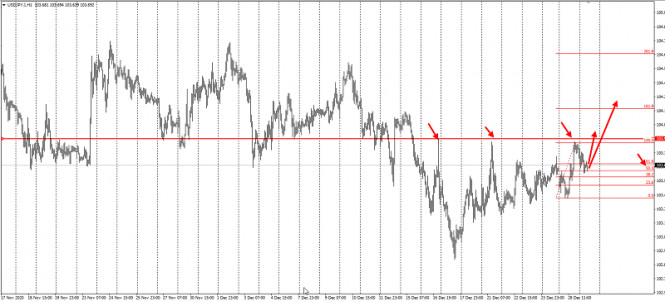
In fact, the quotes have already formed three wave patterns (ABC), where wave "A" is the upward movement observed yesterday. Because of this, long positions may be opened from 103.650, the target of which is a 50% retracement in the market. The risk for wave A is 103.4. If the quote reaches 103.9 or 104, take profit. But if the breakout from 104 turns out to be true, then half of the positions can be held longer. The profit/risk ratio of these transactions is 1:1. Of course, traders have to monitor and control the risks to avoid losing money. Trading is very precarious, but also very profitable as long as you use the right approach. Price Action and Stop Hunting were used for this trading strategy. Good luck! Trading plan for the EUR/USD pair on December 29. COVID-19 infections increased after Christmas; Demand for the European currency continues to grow in the market. 2020-12-29 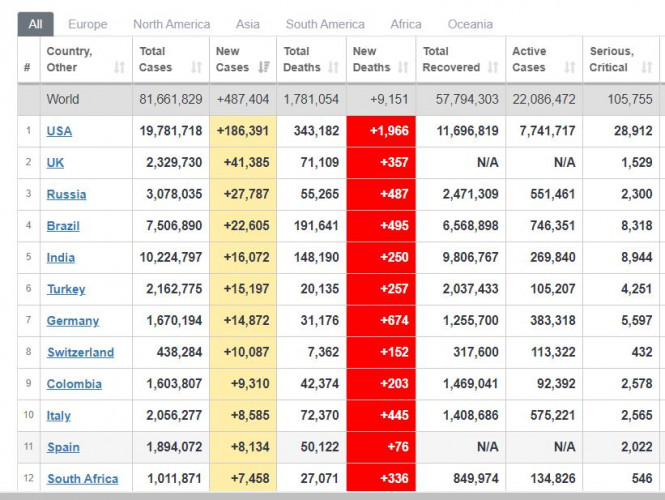
Global COVID-19 incidence grew again after Christmas, reaching approximately + 10% of the record seen on the first day. However, there were significant declines in the past three days, therefore, the situation needs to be closely and carefully monitored before making any conclusion. Nonetheless, the situation in the UK has turned very bad, as authorities have listed 41,000 new cases yesterday. On the bright side, vaccinations are active in the US, UK and the EU. Another good news is that a Brexit trade deal has been concluded, and Trump signed the US budget for 2021, including a $ 900 billion bailout bill. Meanwhile, President-elect Joe Biden is preparing for his inauguration on January 21. 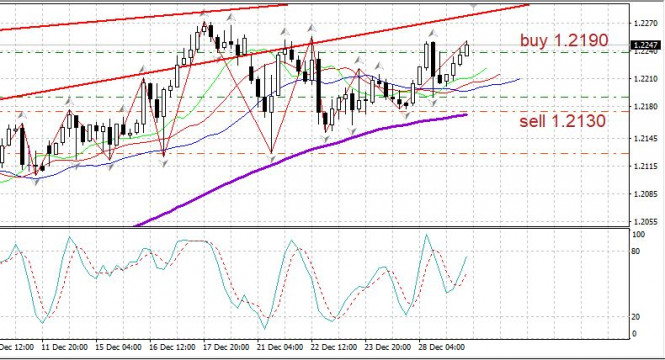
EUR/USD - bulls are still trying to raise the euro in the market. This is already their second attempt. Open long positions from 1.2190. Open short positions from 1.2130. After a reversal, positions may be opened from 1.2180. Technical analysis of AUD/USD for December 29, 2020 2020-12-29 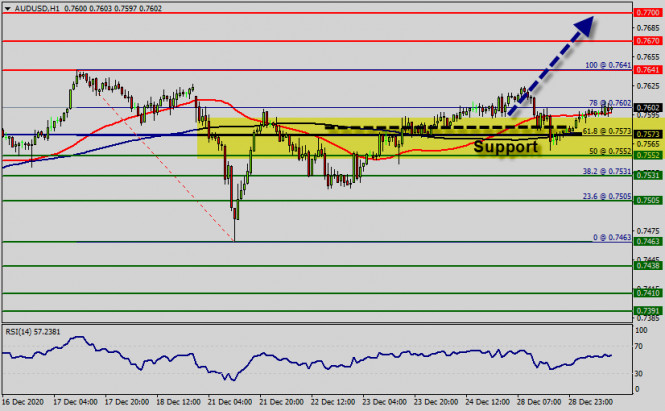 Overview : The AUD/USD pair didn't make any significant movements yesterday. There are no changes in our technical outlook. The bias remains bullish in the nearest term testing 0.7642 or higher. Immediate resistance is seen around 0.7642. Due to the upcoming New Year's holidays, the trading working hours of many major financial centers was changed, which affected the trading of the AUD/USD pair notably, because the market is calm and the trend was not clear. The AUD/USD pair is forming another ascending wave from the area of 0.7550 - 0.7580 in the H1 chart. The AUD/USD pair currency exchange rate is likely to edge higher during this trading session (25/12/2020). In the fact, the AUD/USD pair rallied a bit yesterday heading into the holidays. The market looks likely to continue going higher into the new year. Reaching towards the 0.7602 handle. Today, the AUD/USD pair continues to move upwards from the level of 0.7573. The first support level is currently seen at 0.7573, the price is moving in a bullish channel now. Furthermore, the price has been set above the strong support at the level of 0.7573, which coincides with the 61.8% Fibonacci retracement level. Moreover, the RSI starts signaling an upward trend, and the trend is still showing strength above the moving average (100). Hence, the market is indicating a bullish opportunity above the area of 0.7573. So, the market is likely to show signs of a bullish trend around 0.7573 - 0.7602. This zone of 0.7573 - 0.7602 has rejected several times confirming the veracity of an uptrend today. According to the previous events, we expect the AUD/USD pair to trade between 0.7573 and 0.7641. The market is likely to show signs of a bullish trend around the spot of 0.7573. In other words, buy orders are recommended above the region of 0.7573/0.7602 with the first target at the level of 0.7641; and continue towards 0.7670 (R2) - major resistance stands at 0.7700 (R3). If we were to break down below the 100 day SMA which sits just below the 0.7552 handle we could see a bit further downside. Longer-term trades do lead that we probably go higher based upon motivation and general against US dollar trading. Forecast : According to the previous events the price is expected to remain between 0.7573 and 0.7700 levels in long term. Buy-deals are recommended above 0.7573 with the first target seen at 0.7641. The movement is likely to resume to the point 0.7670 and further to the point 0.7703. Technical analysis of USD/JPY for December 29, 2020 2020-12-29 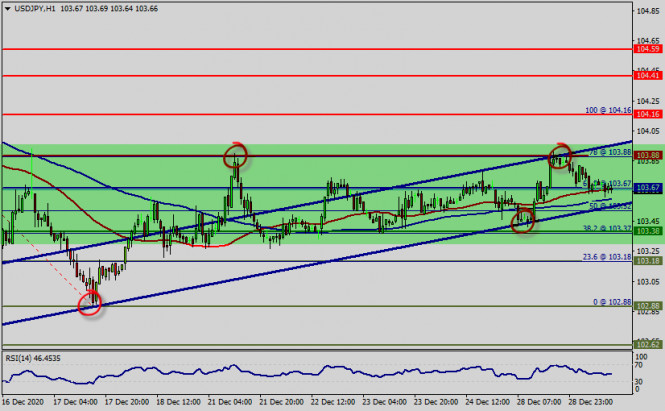 Forecast in medium period (2 days - 4 days): - According to the previous events the price is expected to remain between 102.88 and 104.59 levels.
- Buy-deals are recommended above 103.38 with the first target seen at 103.88. The movement is likely to resume to the point 104.16 and further to the point 104.59.
- The descending movement is likely to begin from the level 104.59 with 103.87 and 103.00 seen as targets.
Outlook : The USD/JPY pair retains its bearish position. In the 1-hour chart, it met sellers around its 100 SMA and 50 SMA, which heads firmly lower at around 103.38. The USD/JPY pair is still staying in long term falling channel that started back in 104.16 since Decmeber 14, 2020). Hence, there is no clear indication of trend reversal yet. The USD/JPY pair has broken support at the level of 103.67 which acts as a resistance now. According to the previous events, the USD/JPY pair is still moving between the levels of 103.67 and 102.88. Therefore, we expect a range of 79 pips in coming hours. The trend is still below the 100 EMA for that the bearish outlook remains the same as long as the 100 EMA is headed to the downside. Thus, the price spot of 103.67 remains a significant resistance zone. The price of 103.67 coincided with a golden ratio (61.8% of Fibonacci), which is expected to act as a major resistance today. Consequently, there is a possibility that the USD/JPY pair will move downside. The structure of a fall does not look corrective. In order to indicate a bearish opportunity below 103.67, sell below 1.1239 with the first target at 103.18. Since the trend is below the 61.8% Fibonacci level, the market is still in a downtrend. Overall, we still prefer the bearish scenario. The trend is still bearish as long as the level of 103.67 is not broken From this point, we expect the USD/JPY pair to continue moving in the bearish trend from the support level of 103.67 towards the target level of 103.18. If the pair succeeds in passing through the level of 103.18, the market will sign the bearish opportunity below the level of 103.18 so as to reach the second target at 102.88 (low wave, bottom). In the same time frame, resistance is seen at the levels of 103.88 and 103.67. The stop loss should always be taken into account for that it will be reasonable to set your stop loss at the level of 104.16. Analysis of GBP/USD on December 29, 2020. European Parliament may ratify agreement with the EU in February-March 2021 2020-12-29 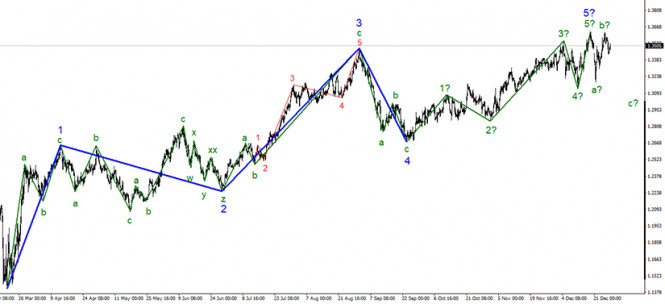
The section of the trend, which originates on September 23, took a five-wave fully completed form. However, the wave counting can become more complex as many times as you like, nevertheless, at the moment everything looks like a completed wave structure. The increase in the quotes of the instrument in the last week is interpreted as a corrective wave b as part of a new downward correction structure of waves. However, a successful attempt to break the maximum of the expected wave 5 in 5 will indicate the readiness of the markets for new purchases of the pound sterling. 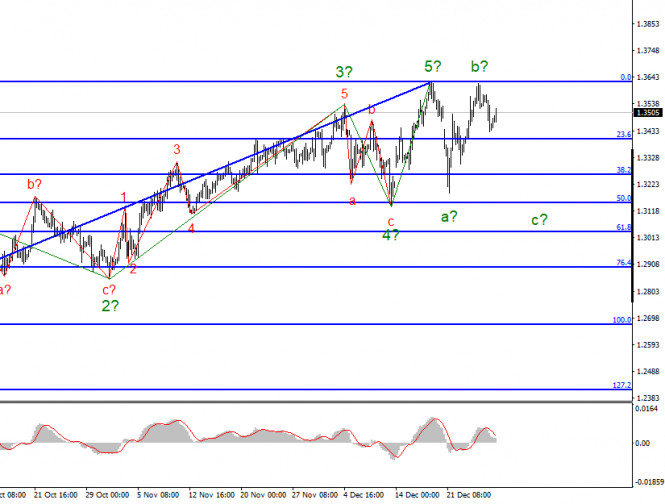
On the lower chart, the wave marking also looks quite convincing and also allows for the option in which the entire section of the trend will take a more complex form. On the approach to the maximum of the expected wave 5 in 5, the pair's quotes turned down and began to retreat. Thus, the current wave marking has been preserved and now assumes the construction of a descending wave c with targets located below the minimum of the expected wave a. Everything I wrote in the article on the Euro/Dollar instrument applies in some way to the Pound/Dollar. There is a certain news background, but it has no meaning for the markets. Markets have been at the mercy of Brexit and trade negotiations between London and Brussels for several years. In a couple of days, Brexit will be officially completed, and the trade deal, if not yet signed, will be agreed upon and will come into effect on January 1, which is the same thing. The European Parliament has already said that it is going to ratify the agreement at a scheduled session in March and has made a proposal to extend the temporary application of the deal, which currently expires at the end of February. Let me remind you that the entire document on the future relations of the UK and the EU occupies 1240 pages, which need to be studied in detail before voting "yes". This is exactly what the members of the European Parliament wants to do in the next two months. The main thing is that there should be no surprises in the form of the fact that any EU country will not be satisfied with the agreement and will veto it. But so far, it seems that everything will be fine. Thus, now we need to bring the current year to its logical conclusion as calmly as possible, and build new plans and strategies next year. Moreover, now it is still impossible to draw any conclusions regarding the new downward section of the trend. There are also no economic reports during the holidays, and no other important events are planned. General conclusions and recommendations: The Pound-Dollar instrument has presumably started building a new downward trend section. Thus, I currently recommend selling the pair for each MACD signal "down" with targets located around the 32nd and 31st figures, within the expected first (global) wave of a new downward trend section. A successful attempt to break the maximum of the wave 5 in 5 will indicate the readiness of traders for new purchases of the pound and cancel the option of building a new downward trend. EUR/USD analysis for December 29. Donald Trump gives in and sings coronavirus relief bill 2020-12-29 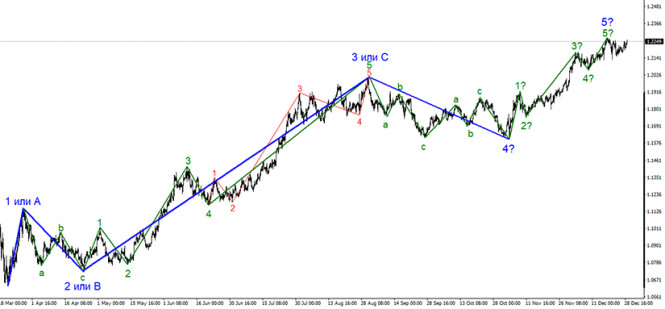 The wave layout for the EUR/USD pair still indicates the formation of an ascending trend section. However, we can assume that the formation of an uptrend has been already completed. I think that at the moment a new downward trend section is being formed, which may turn out to be a three-wave corrective pattern. At the same time, a successful attempt to break through the high of the expected wave 5 in 5 will indicate the bullish trend in the market. As a result, the ascending section may take on a more complex form. 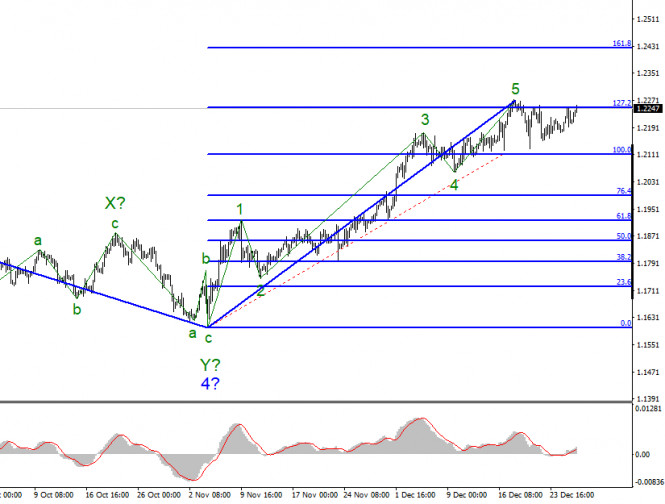 The wave pattern on a smaller time frame also signals a possible completion of the uptrend. The internal wave layout of the supposed wave 5 looks rather clear. So now, at least a three-wave descending pattern can be built. If this is true, then the quotes will continue to decline in the long term to the targets located near the 19th area and below. Three unsuccessful attempts to break through the 127.2% level suggest that the pair is set to start a downward movement soon. However the pair is again testing this level from bottom to top, and this time it may succeed in breaking through it. New Year is approaching, with a few days left ahead. Trading activity on Forex is low due to the festive mood, but traders still open new positions. The euro/dollar pair stays within the uptrend. Almost 30 pips separate the current price level from a yearly high. It seems that the price will finally break through the 127.2% level as market participants are reluctant to buy the US dollar. Therefore, a breakout of this mark will make the ascending trend pattern even more complex. Although different news is coming in recent days, markets seem to downplay this fact. Donald Trump continues to oppose Congress and the Senate in his final month in office. First, the President vetoed the defense spending bill and then refused to sign the coronavirus relief and government funding bill for 2021. The Senate somehow managed to persuade Trump to approve the stimulus package in order to avoid the shutdown. However, in the case with the defense bill, they chose a different strategy. They simply decided to override Trump's veto. This news may seem quite important, but not for the US dollar. Markets are unlikely to react to the disagreement between Trump and the US Congress, given that Joe Biden will take office on January 20. The process of transfer of power has been in full swing for more than a month. Thus, there are hardly any new reasons for the greenback to decline. Its current weakness can be attributed to Christmas and New Year holidays. Conclusion and trading tips The EUR/USD pair seems to have completed the formation of the uptrend. So, I recommend selling the instrument with the targets located near the 20 and 19th area upon every new sell signal from the MACD indicator. At the same time, the wave pattern of the uptrend section may become more complicated and take on a more extended form. For this, the pair needs to break through the 1.2270 mark, which is only 30 pips away from the current price level. Analysis and Forecast for EUR/USD on December 29, 2020 2020-12-29 It was noted that yesterday's trading in the main currency pair of the currency market took place under the impact of the still current US President, D. Trump's signing of a bill regarding the $ 900 billion financial aid to the American economy, as well as the conclusion of a trade agreement between the European Union and Great Britain, for which the parliamentarians of the parting parties still have to vote. EU officials have negotiated quite decent terms for future trade relations with the UK, in particular, for fishing in British waters. However, it will become known tomorrow whether the House of Commons of the British Parliament will vote for this document. Basically, the British side has no other way to avoid economic collapse. Meanwhile, Europe is strongly getting ready to meet the third wave of COVID-19, especially after the virus began to mutate. According to the latest data, a new strain of coronavirus infection has already reached Germany. This could lead to an even greater tightening of quarantine measures, which will not be received well by the leading European economy. In addition, one of the most important topics recently is the mass vaccination of Europeans. However, in order to develop collective immunity against coronavirus, it is necessary to vaccinate about 70% of the inhabitants of European countries, which will take some time and the result will be only by spring. Today's economic calendar is almost empty, so the course of trading in the EUR/USD pair will be determined by market mood and the technical factor. Daily 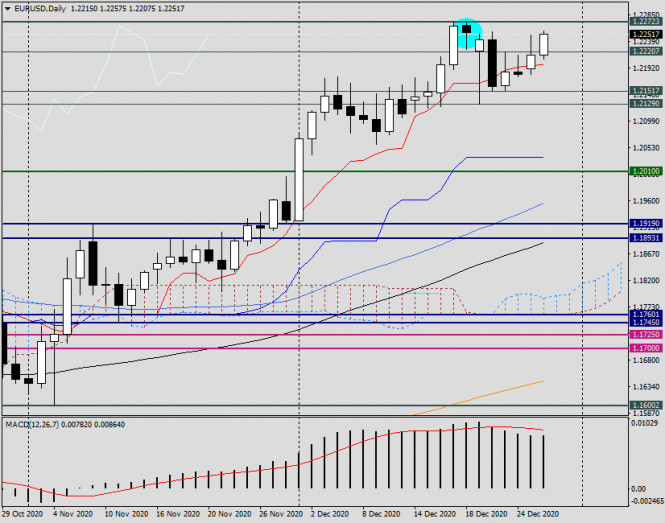
The pair failed to rise above the level of 1.2250 and closed Monday trading at 1.2214, despite yesterday's initial growth. On the one hand, the closing of the day above the important level of 1.2200 can be attributed to the euro bulls. However, on the other hand, the strong resistance of the sellers at the level of 1.2272 remains an unbroken barrier that prevents the main currency pair from continuing to rise to higher prices. During the time of this writing, the euro/dollar is showing growth and is trading near the level of 1.2243, but the day has not yet ended and it is not known how it will end. If the quotes continue to rise and today's trading ends above 1.2272, this will be a signal that the pair is ready to continue its growth. As mentioned before, the nearest target will be the strong price zone 1.2300-1.2320. If a bearish candlestick analysis pattern appears on the daily chart at the end of trading, this may signal a reversal or at least a corrective pullback of EUR/ USD. H4 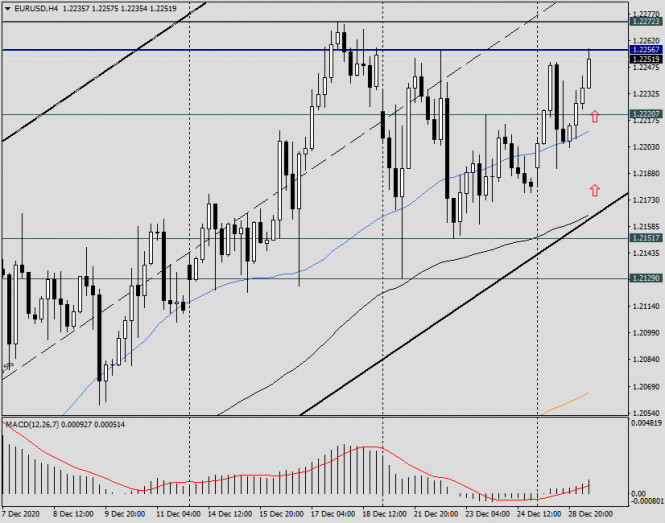
Let's turn to the four-hour chart in order to outline today's trading recommendations. It can be noticed that the euro/dollar pair is still trading in a rising channel within the limits of 1.1601-1.1799 (support line) and 1.1919 (resistance line). It is clearly seen that the 50 simple moving average supports the quote and does not let it lower for now. Therefore, I recommend buying deals after a decline to 50 MA, which is 1.2211. Another option for opening long positions at more attractive prices will be a decline to the lower limit of the channel, where the black 89 exponential moving average is also located. This is the price zone near the level of 1.2165. If a bearish pattern or candlestick analysis patterns appear on this or hourly time frames after rising to 1.2256-1.2272, a signal will appear to open sales. In conclusion, I would like to recommend not to set big goals in both cases, as the pre-holiday market is prone to frequent changes of mood. Analysis and Forecast for GBP/USD on December 29, 2020 2020-12-29 Today's review of the pound/dollar pair starts with a breakdown of the weekly time frame. It should be recalled that the main and extremely positive event for the British currency was the agreement to sign a trade agreement, which avoids the "hard Brexit" or no-deal option. If the House of Commons of the British Parliament ratifies this agreement, this will allow the British economy to avoid the most negative scenario, as it is known to anyone that the EU will remain the United Kingdom's largest trading partner, even after the UK's official exit from the European Union. Weekly 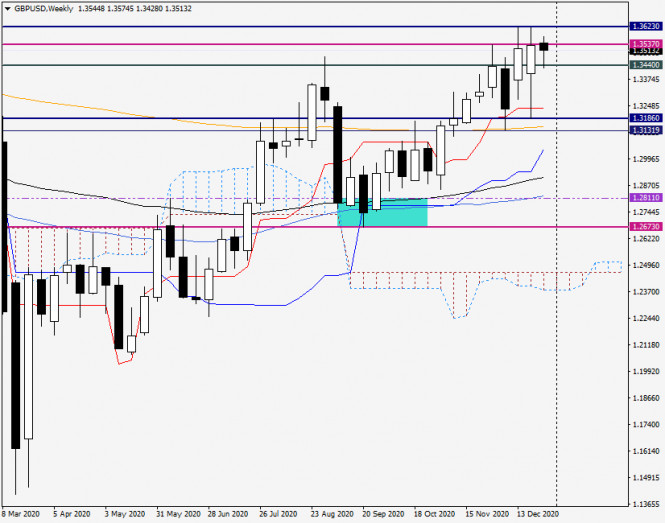
Despite the growth shown during two consecutive trading weeks, the pound/dollar pair failed to break through the sellers' strong resistance not only in the level of 1.3623, but also in the level of 1.3537. As a result of repeated attempts, the last level was only broken, however, the pound bulls failed to close the weekly session above the level of 1.3537. This happened despite the reached agreement on future trade relations with the European Union. Therefore, the current five-day period began negatively for the GBP/USD pair. It pulled back to the level of 1.3428, found a strong support there and recovered its losses. If the downward trend continues to change into an upward one, and the bulls manage to complete the weekly trades above 1.3623, the direction will open to a strong and significant technical zone 1.3700-1.3740. On the other hand, if a bearish model of Japanese candlesticks appears as a result of attempts to break through the level of 1.3623, the pair can be expected for at least a corrective pullback. The target of which may be the price area of 1.3240-1.3180. Daily 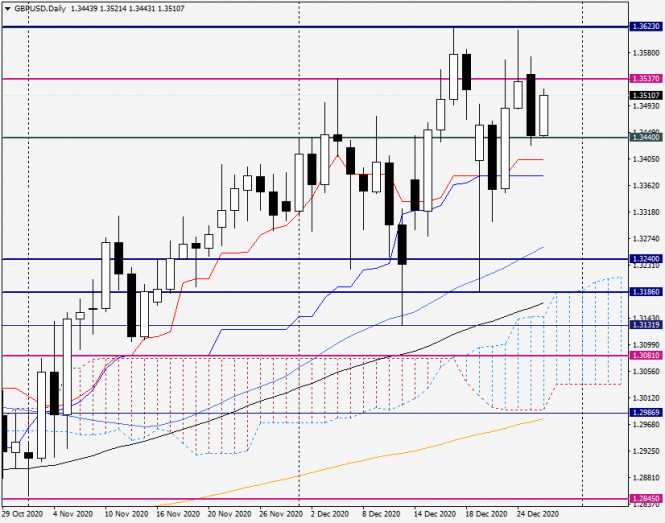
Yesterday, the pair showed a quite impressive decline and closed Monday's trading at the level of 1.3444 after the appearance of Friday's candle with a particularly long upper shadow. Today's trading for the GBP/USD pair is going positively. It is showing growth and is trading near the level of 1.3510. If the upward trend continues, the next task for the pound bulls will be to close today's session above yesterday's highs shown at 1.3574. Meeting this condition will allow you to retest the strong resistance level of 1.3623, where the maximum trading values were shown on December 17 and 24. However, the bulls should do its best, since the market has won back the positivity from the conclusion of the trade deal between the UK and the EU. Nevertheless, the main trading recommendation for the pound/dollar pair is to buy, which are best viewed after short-term declines to the area of 1.3460-1.3430. A signal to open sales will appear if a bearish candlestick analysis pattern forms on the daily, four-hour and/or hourly charts in the resistance price zone 1.3575-1.3620. In terms of today's economic calendar, the US house price index from S&P/Case-Shiller is the only statistics scheduled to be reported, which will be published at 14:00 Universal time. Despite this, I still believe that the course of trading will depend on market mood and the technical component. EUR/USD analysis for December 29 2020 - Firsst ttarget at the price of 1.2250 has been reached, second target in play at 1.2270 2020-12-29 Georgia runoffs will be one of the first key risk events for the market going into the new year Will Republicans keep hold of the Senate or can Democrats seize control? The two runoff elections will take place on 5 January next year i.e. next Tuesday, with plenty on the line in determining how US politics will shape up under Biden's administration over the coming year(s). As things stand, Republicans hold 50 seats and Democrats 48 seats in the Senate. For Republicans to keep control, they would only need to win one of the two runoffs while Democrats need to win both to technically take control of the Senate. A tie will result in vice president-elect, Kamala Harris, breaking the deadlock. In terms of hardcore Biden policies, the results here won't matter but the optics on its own may be enough to at least get the market feeling more relieved if Congress isn't divided Further Development 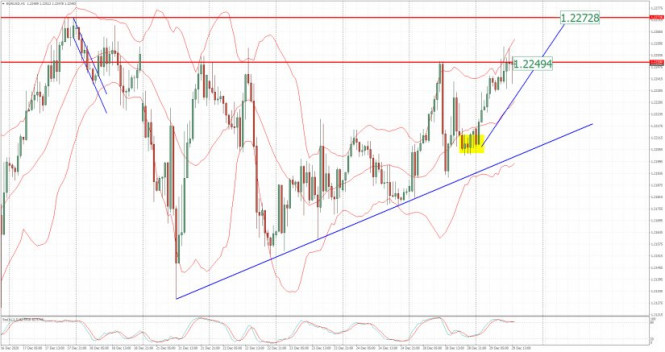
Analyzing the current trading chart of EUR, I found that the EUR reached my first yesterday's target at 1,2250 and is heading towards the second target at 1,2270. Watch for potential buying opportunities on the dips with the the target at 1,2270. Stochastic oscillator is showing the fresh bull cross, which is confirmation for the upside continuation. 1-Day relative strength performance Finviz 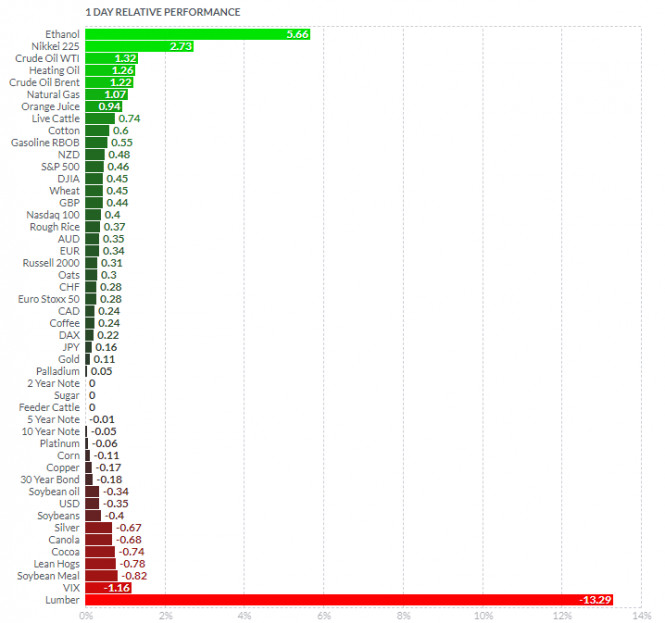
Based on the graph above I found that on the top of the list we got Ethanol and Nikkei today and on the bottom Lumber and VIX. Key Levels: Resistance: 1,2270 Support level: 1,2235 Analysis of Gold for December 29,.2020 - Testing of the rising trendline and potential for higher price towards $1.895 2020-12-29 Standout day for Japanese stocks as Nikkei 225 breaches key milestone Nikkei 225 breaks above 27,000 for the first time since 1991 The late rally into the year-end in the equities space is turning into a bit of a precursor for next year as we're seeing stocks get a sort of head start amid thinner liquidity conditions in trading this week. The Nikkei closed higher by a stunning 2.7% today before the final day of trading tomorrow and while window dressing may be part of a factor, the jump today breaks the consolidation period since the pause after the November rally. 
Further Development 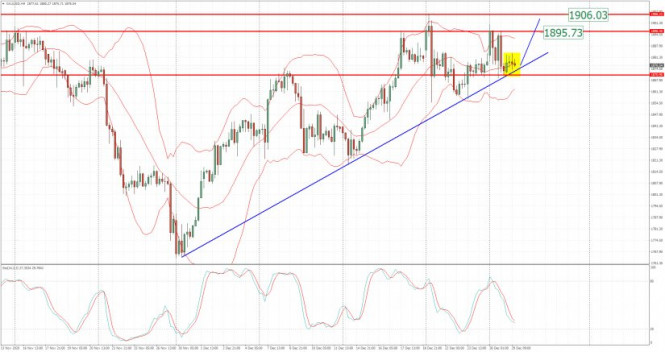
Analyzing the current trading chart of Gold, I found that there is the consolidation period, which is normal during the late December due to lower volatility and liquidity but there is still chance for higher prices. Watch for potential buying opportunities on the dips with the the targets at $1,895 and $1,905. Stochastic oscillator is showing potential bull cross, which is sign for another up cycle... 1-Day relative strength performance Finviz 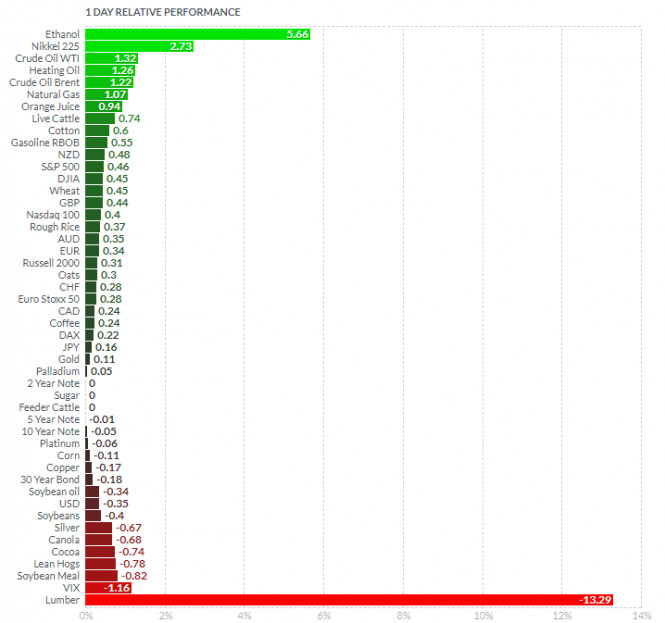
Based on the graph above I found that on the top of the list we got Ethanol and Nikkei today and on the bottom Lumber and VIX. Gold is slightly positive for the day, which is sign for the continuation. Key Levels: Resistance: $1,895 and $1,905 Support level: $1,870
Author's today's articles: Irina Manzenko  Irina Manzenko Irina Manzenko Andrey Shevchenko  Andrey Shevchenko Andrey Shevchenko Mihail Makarov  - - Mourad El Keddani  Was born in Oujda, Morocco. Currently lives in Belgium. In 2003 obtained B.S. in Experimental Sciences. In 2007 obtained a graduate diploma at Institut Marocain Specialise en Informatique Applique (IMSIA), specialty – Software Engineering Analyst. In 2007–2009 worked as teacher of computer services and trainer in a professional school specializing in computer technologies and accounting. In 2005 started Forex trading. Authored articles and analytical reviews on Forex market on Forex websites and forums. Since 2008 performs Forex market research, and develops and implements his own trading strategies of Forex analysis (especially in Forex Research & Analysis, Currency Forecast, and Recommendations and Analysis) that lies in: Numerical analysis: Probabilities, equations and techniques of applying Fibonacci levels. Classical analysis: Breakout strategy and trend indicators. Uses obtained skills to manage traders' accounts since 2009. In April 2009 was certified Financial Technician by the International Federation of Technical Analysts. Winner of several social work awards: Education Literacy and Non-Formal Education (in Literacy and Adult Education in The National Initiative for Human Development). Was born in Oujda, Morocco. Currently lives in Belgium. In 2003 obtained B.S. in Experimental Sciences. In 2007 obtained a graduate diploma at Institut Marocain Specialise en Informatique Applique (IMSIA), specialty – Software Engineering Analyst. In 2007–2009 worked as teacher of computer services and trainer in a professional school specializing in computer technologies and accounting. In 2005 started Forex trading. Authored articles and analytical reviews on Forex market on Forex websites and forums. Since 2008 performs Forex market research, and develops and implements his own trading strategies of Forex analysis (especially in Forex Research & Analysis, Currency Forecast, and Recommendations and Analysis) that lies in: Numerical analysis: Probabilities, equations and techniques of applying Fibonacci levels. Classical analysis: Breakout strategy and trend indicators. Uses obtained skills to manage traders' accounts since 2009. In April 2009 was certified Financial Technician by the International Federation of Technical Analysts. Winner of several social work awards: Education Literacy and Non-Formal Education (in Literacy and Adult Education in The National Initiative for Human Development).
Languages: Arabic, English, French and Dutch.
Interests: Algorithm, Graphics, Social work, Psychology and Philosophy. Alexander Dneprovskiy  Graduated from Kiev State University of Economics. On Forex market since 2007. Started his work at Forex as a trader. Since 2008 is working as a currency analyst. Graduated from Kiev State University of Economics. On Forex market since 2007. Started his work at Forex as a trader. Since 2008 is working as a currency analyst. Ivan Aleksandrov  Ivan Aleksandrov Ivan Aleksandrov Petar Jacimovic  Petar was born on July 08, 1989 in Serbia. Graduated from Economy University and after has worked as a currency analyst for large private investors. Petar has been involved in the world of finance since 2007. In this trading he specializes in Volume Price Action (volume background, multi Fibonacci zones, trend channels, supply and demand). He also writes the market analytical reviews for Forex forums and websites. Moreover Petar is forex teacher and has wide experience in tutoring and conducting webinars. Interests : finance, travelling, sports, music "The key to success is hard work" Petar was born on July 08, 1989 in Serbia. Graduated from Economy University and after has worked as a currency analyst for large private investors. Petar has been involved in the world of finance since 2007. In this trading he specializes in Volume Price Action (volume background, multi Fibonacci zones, trend channels, supply and demand). He also writes the market analytical reviews for Forex forums and websites. Moreover Petar is forex teacher and has wide experience in tutoring and conducting webinars. Interests : finance, travelling, sports, music "The key to success is hard work"
Subscription's options management Theme's:
Fundamental analysis, Fractal analysis, Wave analysis, Technical analysis, Stock Markets
Author's :
A Zotova, Aleksey Almazov, Alexander Dneprovskiy, Alexandr Davidov, Alexandros Yfantis, Andrey Shevchenko, Arief Makmur, Dean Leo, Evgeny Klimov, Fedor Pavlov, Grigory Sokolov, I Belozerov, Igor Kovalyov, Irina Manzenko, Ivan Aleksandrov, l Kolesnikova, Maxim Magdalinin, Mihail Makarov, Mohamed Samy, Mourad El Keddani, Oleg Khmelevskiy, Oscar Ton, Pavel Vlasov, Petar Jacimovic, R Agafonov, S Doronina, Sebastian Seliga, Sergey Belyaev, Sergey Mityukov, Stanislav Polyanskiy, T Strelkova, Torben Melsted, V Isakov, Viktor Vasilevsky, Vladislav Tukhmenev, Vyacheslav Ognev, Yuriy Zaycev, Zhizhko Nadezhda
Edit data of subscription settings
Unsubscribe from the mailing list Sincerely,
Analysts Service | If you have any questions, you can make a phone call using one of the
InstaForex Toll free numbers right now:
|  |  InstaForex Group is an international brand providing online trading services to the clients all over the world. InstaForex Group members include regulated companies in Europe, Russia and British Virgin Islands. This letter may contain personal information for access to your InstaForex trading account, so for the purpose of safety it is recommended to delete this data from the history. If you have received this letter by mistake, please contact InstaForex Customer Relations Department. |


 Irina Manzenko
  Andrey Shevchenko
  -
-  Was born in Oujda, Morocco. Currently lives in Belgium. In 2003 obtained B.S. in Experimental Sciences. In 2007 obtained a graduate diploma at Institut Marocain Specialise en Informatique Applique (IMSIA), specialty – Software Engineering Analyst. In 2007–2009 worked as teacher of computer services and trainer in a professional school specializing in computer technologies and accounting. In 2005 started Forex trading. Authored articles and analytical reviews on Forex market on Forex websites and forums. Since 2008 performs Forex market research, and develops and implements his own trading strategies of Forex analysis (especially in Forex Research & Analysis, Currency Forecast, and Recommendations and Analysis) that lies in: Numerical analysis: Probabilities, equations and techniques of applying Fibonacci levels. Classical analysis: Breakout strategy and trend indicators. Uses obtained skills to manage traders' accounts since 2009. In April 2009 was certified Financial Technician by the International Federation of Technical Analysts. Winner of several social work awards: Education Literacy and Non-Formal Education (in Literacy and Adult Education in The National Initiative for Human Development).
 Graduated from Kiev State University of Economics. On Forex market since 2007. Started his work at Forex as a trader. Since 2008 is working as a currency analyst.
  Ivan Aleksandrov
  Petar was born on July 08, 1989 in Serbia. Graduated from Economy University and after has worked as a currency analyst for large private investors. Petar has been involved in the world of finance since 2007. In this trading he specializes in Volume Price Action (volume background, multi Fibonacci zones, trend channels, supply and demand). He also writes the market analytical reviews for Forex forums and websites. Moreover Petar is forex teacher and has wide experience in tutoring and conducting webinars. Interests : finance, travelling, sports, music "The key to success is hard work"
No comments:
Post a Comment