| Two reasons to buy gold 2020-12-30 A weak dollar and a rapid increase in inflation. Two key topics that will excite the gold market in 2021. Are the forecasts of Bloomberg experts about the continuation of the downward trend in the USD index correct? Will large-scale fiscal and monetary stimulus really accelerate consumer prices? The fate of the precious metal will depend on the answers to these questions. Gold's success in 2020 was largely due to the rapid response of central banks and governments to the recession. The Fed, ECB, and Bank of Japan have provided financial markets with about $8 trillion in additional liquidity over several months. It took them 8 years to do the same in response to the previous global economic crisis. Then inflation did not accelerate, which led to the fall of XAUUSD from the levels of the previous record high above 1900 to 1050. This time, the monetary stimulus was greater, the Fed acted more aggressively. It is quite possible that this will be enough for a rise in consumer prices. Moreover, the monetary policy of central banks is not the only factor in the growth of inflation expectations. Once humanity begins to defeat COVID-19, the pent-up demand will drive prices up. The impact of oil on inflation should also be taken into account. It manifests itself with a time lag. Dynamics of oil and inflation expectations 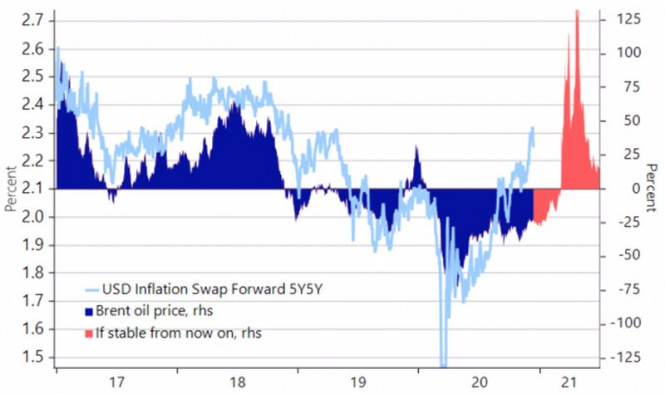
The key role in the rumors about the reflationary environment was played not so much by the Federal Reserve as by the US Congress. In December, a $2.3 trillion fiscal stimulus and government spending bill was passed in Congress. Moreover, Donald Trump voiced the idea of increasing checks per American from $600 to $2000, which immediately resonated with the Democrats. The House of Representatives has approved a document that will increase the amount of aid to the US economy by about $464 billion. Republicans in the Senate object, but markets believe that under Joe Biden, the fiscal stimulus will be expanded, which fuels talk of a crackdown on inflation and contributes to the growth of XAUUSD. Double deficits (current account and budget), low real yields on US Treasury bonds, and the Fed's intention not to raise the federal funds rate until at least the end of 2023 are putting pressure on the dollar, which is also good news for gold. The US dollar is actively sold due to the growth of global risk appetite, which lowered the net positions of non-profit traders on the USD index to the lowest levels since 2011. Dynamics of net positions of non-commercial traders in the US dollar 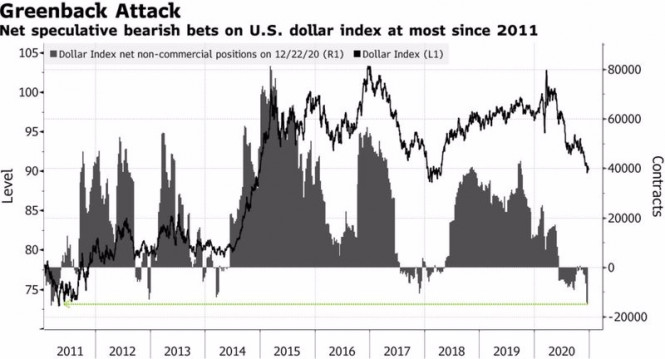
In such conditions, the risks of a pullback due to the avalanche-like closing of short positions increase. The reason may be the growth of uncertainty or the implementation of the principle of "buy the rumor, sell the fact" after the inauguration of Joe Biden. Nevertheless, the correction of the precious metal is unlikely to be deep. Thanks to the weak dollar and the acceleration of inflation, it is quite capable of returning above the $2000 per ounce mark in 2021. Technically, the potential for a gold rally is likely to be limited by this important level. The probability of forming a 1-2-3 reversal pattern is high. Short-term pullbacks to $1840, $1805, and $1775 should be used for purchases. Gold, monthly chart 
Forex forecast 12/30/2020 on EUR/CHF, USD/JPY, Oil and Gold from Sebastian Seliga 2020-12-30 Let's take a look at the technical analysis of EUR/CHF, USD/JPY, Crude Oil and Gold on the daily time frame chart. Analysis and forecast for EUR/USD on December 30, 2020 2020-12-30 The main currency pair ends the current year with a sharp growth in the market. Its upward movement continued during yesterday's trading, however, the euro bulls failed to break through the strong resistance level at 1.2272. We will give more details about this in the technical part of the review. But for now, you should remember what moves investors to risky operations and creates an overall positive market sentiment. It should be recalled that the overall budget for the 2021 fiscal year will be $ 2.3 trillion, before it became known that the still incumbent President, Mr. Donald Trump still managed to insist on his own and agree with the US Congress to increase payments to citizens from $ 600 to $ 2 thousand. From the total budget, $ 900 billion will be allocated to support the world's leading economy from the consequences of the COVID-19 pandemic. In this regard, positive moods are observed on the global financial markets, the US dollar is weakening, and the European and commodity currencies are strengthening. With regards to the ratification of the trade agreement between the UK and the European Union, European parliamentarians have already begun working on approving the bill. There should be no problems here, since the deal is more favorable of Brussels. Today, the House of Commons of the British Parliament will start the process of ratifying the deal that Prime Minister Boris Johnson signed with his European counterparts. I believe that the debate here will be much more intense, but in principle, the British have nowhere to retreat, since a hard Brexit can become a real collapse for the economy of the United Kingdom. Today, the economic calendar of European reports is not scheduled. In the United States, data on the foreign trade balance, the Chicago purchasing managers' index, as well as data on pending home sales transactions will be released starting from 13:30 (Universal time). However, these publications are unlikely to have a significant impact on the course of trading on the euro/dollar, but still they should be kept in mind. Daily 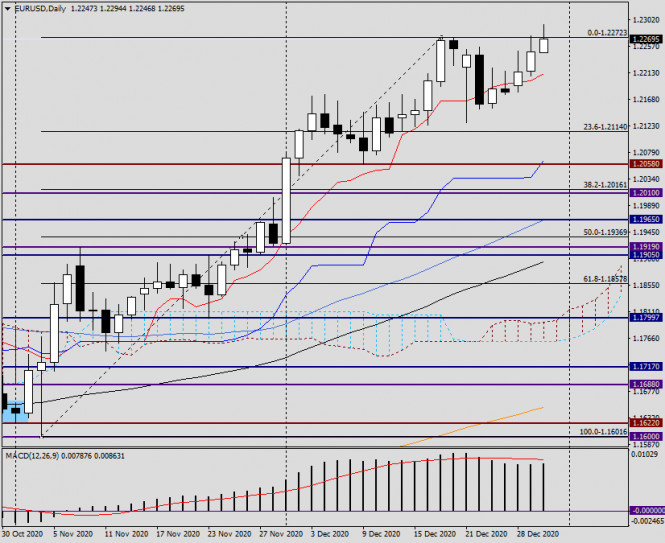
It can be assumed that technical factors, news from the UK, as well as the general mood of investors, will primarily affect the price dynamics of the EUR/USD pair. According to the technical picture, we should focus our attention to the sellers' strong resistance in the area of 1.2272-1.2294. On December 29, the euro bulls tried again to break through this value, but they only pierced it. The pair pulled back and ended the session at 1.2247, after reaching highs of 1.2274. Nevertheless, the bulls should be given credit, because they are not yet surrendering. At today's trading, they made an attempt to approach the unconquered peaks. The pair was found at the level of 1.2294, but met a strong resistance again. As a result, it pulled back and is trading near the level of 1.2258. Trading ideas for the euro/dollar pair remain the same. This is opening deals with a trend, that is, buying. However, the recommendations will be different depending on who uses the trading strategy. In my opinion, the best option is to buy after small corrective pullbacks, for example, from current prices near 1.2258. It is always uncomfortable and risky to buy at the peak of the market, and even at the breakout of such a strong resistance level, which is 1.2272. But if this level is still broken on both the four-hour and hourly charts, the pair will consolidate above. Another option is to buy the single European currency on a pullback to the area of 1.2270. However, considering that another rather significant level 1.2300 passes slightly higher, it is better and safer to buy EUR/USD from the depth. In this case, the stop can be hidden lower, and if successful, the profit will be greater. Technical recommendations for EUR/USD and GBP/USD on 12/30/20 2020-12-30 EUR/USD 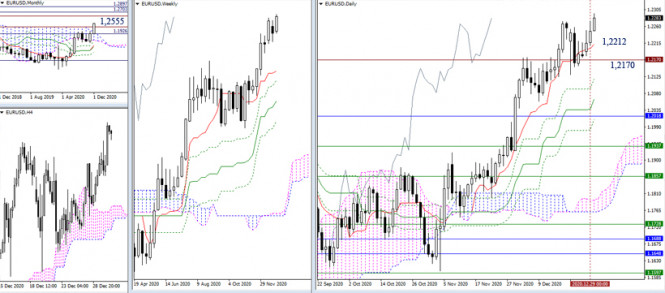 The euro/dollar pair seeks to mark a new annual high on the chart before December closes. The bullish optimism of this month's candle will strengthen growth expectations towards the next upside targets. They are currently located at the historical level of 1.2555 and the monthly target for the breakdown of the Chinkou price chart (1.2703 - 1.2897). On the other hand, the loss of nearest important supports, which remain at 1.2212 (daily short-term trend) and 1.2170, will affect the current distribution of forces. 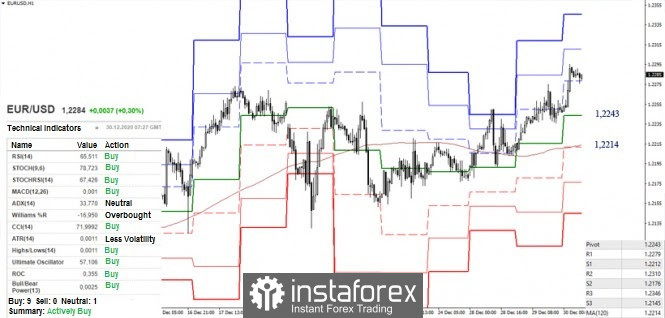 The bulls successfully maintain and develop their advantages, continuing the upward trend. Among the intraday pivot points, the resistance of the classic pivot levels of 1.2310 (R2) and 1.2346 (R3) can be noted. If a downward correction develops, we can adhere to the key supports, which are now at 1.2243 (central pivot level) and 1.2214 (weekly long-term trend). These levels were strengthened by the daily Tenkan (1.2212), so their loss will affect the balance of power not only in the smaller time frames, but also deprive the bulls in the daily short-term trend. GBP/USD 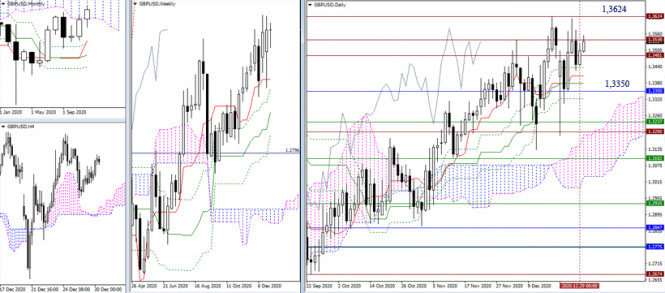 The situation of the pound remains unchanged. The pound/dollar pair is moving to the attraction zone of historical levels 1.3481 - 1.3538. In turn, the role of supports is reserved for the levels of the Ichimoku daily cross (1.3437 - 1.3405 - 1.3379 - 1.3321), which is strengthened by the lower limit of the monthly cloud (1.3350). Here, new plans of the bulls and the recovery of the upward trend, continue to rest against the maximum extreme of 1.3624. 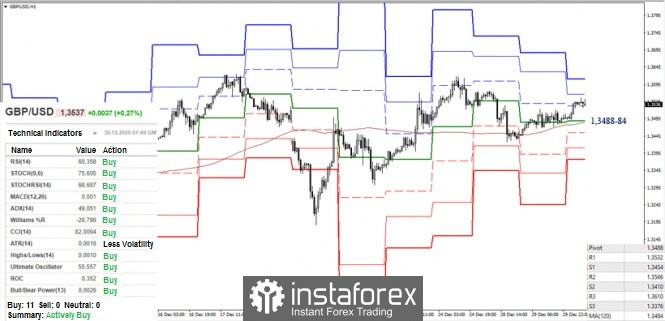 The bulls in the smaller time frames still maintained their initial advantage, moving above the key supports that are now joining forces at 1.3484-88 (center pivot level + weekly long-term trend). The most significant pivot points for bullish traders remains the highest extremum (1.3624). Now, the resistances of the classic pivot levels can be noted at 1.3566 and 1.3610. On the contrary, if the support levels of 1.3484-88 will be broken, it will change the current balance of power, shifting priorities to the bearish side. At the same time, the support of the classic pivot levels, which are located at 1.3454 - 1.3410 - 1.3376 today, will become relevant. Ichimoku Kinko Hyo (9.26.52), Pivot Points (classical), Moving Average (120) Analysis and Forecast on GBP/USD for December 30, 2020 2020-12-30 After a corrective pullback, which took place at the auction on December 28, the pound/dollar currency pair returned to an upward trend and demonstrates growth for the second day in a row. Before proceeding to the consideration of the GBP/USD price charts, let's discuss a little bit about the external background and those events that may affect the course of trading in the pound sterling. As you know, today the House of Commons of the British Parliament will begin the process of ratifying the trade agreement that Boris Johnson concluded with his European opponents. As already suggested in today's article on EUR/USD, this document will most likely not be adopted easily and simply, but still, to a greater extent, you can count on a positive result, since a hard Brexit will hit the British economy hard, which, therefore, is far from in the best situation. Now it is worth touching on the topical issue of the COVID-19 pandemic. As you know, the UK has become the most affected country from the coronavirus after Italy. In total, 71,000 deaths from the COVID-19 epidemic were recorded, and over the past day, the number of infected people in the United Kingdom amounted to 53,000. The medical system in the UK is running at its limit, hospitals are overloaded, and there are not always enough necessary medicines. According to experts, the British health care system is quite expensive and inefficient. This problem did not appear yesterday and radical reforms are needed here. However, the UK government first needs to finalize the divorce with the European Union, and with the least losses for the country. Looking at today's economic calendar, you can pay attention to the data from the United States of America, which will begin to arrive starting from 13:30 UTC. Daily 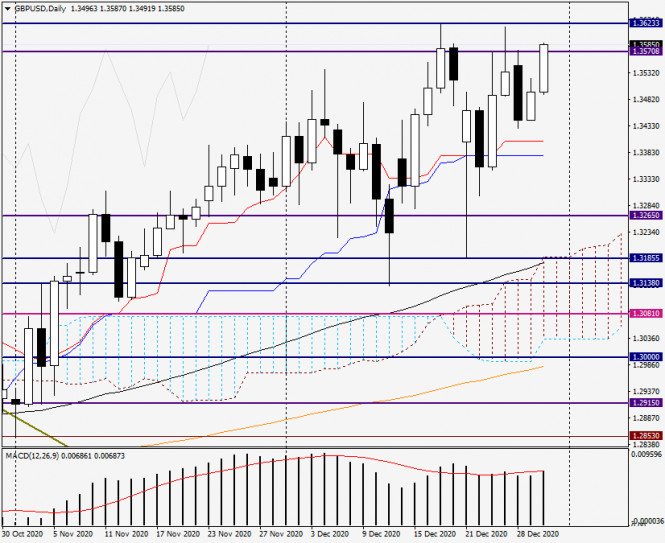
As already noted at the beginning of the article, yesterday and today(at the time of writing), the pound/dollar currency pair is showing growth and is now trading near 1.3578. At this point in time, there is a breakdown of the resistance of sellers at 1.3570, or rather, attempts to overcome this strong technical level. However, there is an equally strong technical zone located nearby (1.3600-1.3620), overcoming which will send the pair to the area of 1.3700. At this stage of time, the key resistance of sellers is in the area of 1.3618-1.3623, where the maximum trading values were shown on December 17 and 24, respectively. Trading recommendations for the GBP/USD pair mostly involve buying sterling, but the vote in the British parliament can lead to increased volatility, so you need to be careful and not rush to enter the market. In my opinion, the best option for opening long positions on the pound is to look for after a short-term decline of the pair in the price area of 1.3500-1.3480. However, a short-term drop may be more significant and reach the price zone of 1.3450-1.3430. In the event of negative news from the UK on the ratification of the agreement with the EU and the appearance of today's reversal model of candle analysis, it will be possible to think about selling the pair. But, if there is such an option, we will consider it in tomorrow's article. Good luck! GBP/USD analysis on December 30. Pound is rising again amid expectations of UK and EU's formal signing of trade agreement 2020-12-30 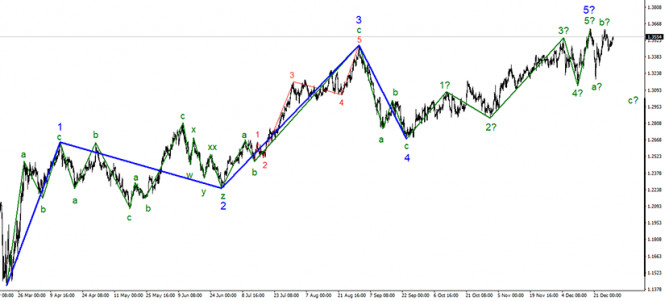
The trend section, which originated on September 23, finally took a complete five-wave form. In this case, the wave pattern can become much more complicated, but currently, everything seems to be a completed wave structure. Even last week's price growth of the instrument is still interpreted as a corrective wave b as part of a new downward correction pattern of waves. However, a successful attempt to break the high of the expected wave 5-5 will indicate the readiness of the markets to make new purchases of the pound. 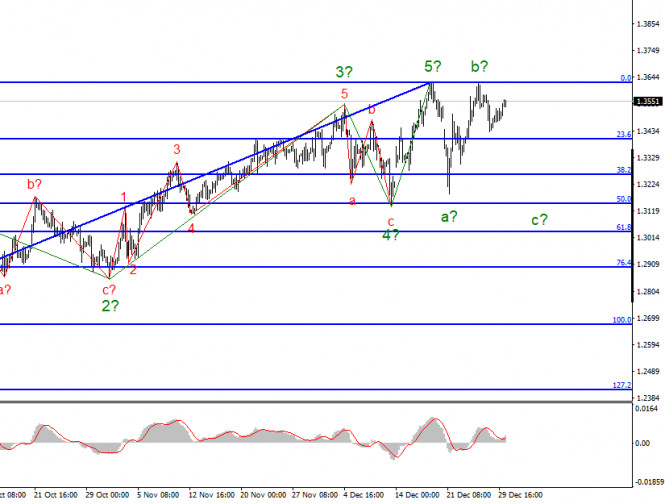
In the smaller time frame, the wave marking also looks quite convincing and allows the option in which the entire section of the trend will take a more complex form. At the moment, the pair's quotes declined and began to retreat, while approaching the high of the expected 5 in 5. Thus, the current wave marking has been maintained and so, we can assume the construction of a descending wave c with targets located below the low of the expected wave a. At the same time, a successful attempt to break the maximum of waves 5 and b will indicate markets' desire to continue buying the British currency. In terms of news background, a trade deal between the UK and the EU is likely to be signed by both parties today. However, this is just a formality, which no longer has any special meaning. London and Brussels have already agreed and this is the most important thing. Nevertheless, the markets can still see today's event as a positive development. Moreover, if we also consider the evening news from the United States, where Congress approved to increase the one-time financial aid to Americans from $ 600 to $ 2,000, which the markets regarded as a negative moment, then it is logical why the pound is rising again, and the dollar is declining. At the end of 2020, the wave pattern and the mood of the markets remain unchanged. The British currency is likely to break through the highs of the previous two waves today or tomorrow before the New Year, which will lead to an even greater complication of the upward trend section. At the same time, markets are still unwilling or unable to find a reason to buy the dollar, since its unrestrained decline is very hard to stop. Thus, this situation can persist for a long time. In this case, we can expect the wave pattern to simply become more complex and lengthen. General conclusions and recommendations: The pound/dollar instrument has presumably started building a new downward trend section. Thus, I currently recommend selling it for each MACD "sell" signal with targets located around 32nd and 31st figures, within the expected first (global) wave of a new downward trend section. A successful attempt to break the high of wave 5-5 will indicate trader's readiness to buy the pound, which will cancel the option of building a new downward trend. Technical analysis of EUR/USD for December 30, 2020 2020-12-30 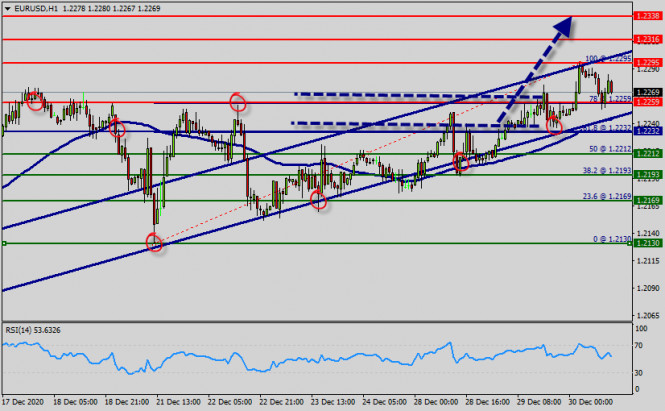 Overview : EUR/USD : Further close above the high end may cause a rally towards 1.2259. Nonetheless, the weekly resistance level and zone should be considered. The EUR/USD pair will continue to rise from the level of 1.2259. The support is found at the level of 1.2232, which represents the 61.8% Fibonacci retracement level in the H1 time frame. The price is likely to form a double bottom. Today, the major support is seen at 1.2232, while immediate resistance is seen at 1.2295. Accordingly, the EUR/USD pair is showing signs of strength following a breakout of a high at 1.2259. So, buy above the level of 1.2259 with the first target at 1.2295 in order to test the daily resistance 1 and move further to 1.2316. Also, the level of 1.2295 is a good place to take profit because it will form a double top. Amid the previous events, the pair is still in an uptrend; for that we expect the EUR/USD pair to climb from 1.2232 to 1.2316 today. At the same time, in case a reversal takes place and the EUR/USD pair breaks through the support level of 1.2232, a further decline to 1.2130 can occur, which would indicate a bearish market. Technical analysis of GBP/USD for December 30, 2020 2020-12-30 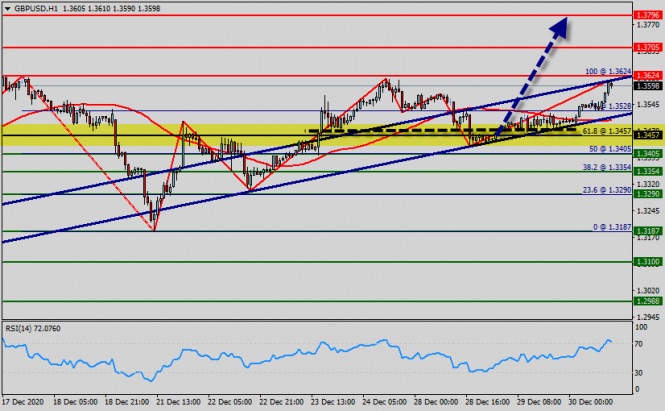 Overview : The GBP/USD pair broke the resistance that turned into strong support at the level of 1.3457 this week. The level of 1.3457 coincides with a golden ratio (61.8% of Fibonacci), which is expected to act as a major support on the H1 chart today. Consequently, the first support is set at the level of 1.3457. Moreover, the RSI starts signaling an upward trend, and the trend is still showing strength above the moving average (100). Hence, the market is indicating a bullish opportunity above the area of 1.3457. So, the market is likely to show signs of a bullish trend around 1.3457 - 1.3500. In other words, buy orders are recommended above the ratio of 61.8% Fibonacci (0.9966) with the first target at the level of 1.3705 in order to test first resistance in the same time frame. If the pair succeeds to pass through the level of 1.3705, the market will probably continue towards the next objective at 1.3796. The daily strong support is seen at 1.3457 - 1.3500. Thus, if a breakout happens at the support level of 1.3457 / 1.3500, then this scenario may be invalidated. Analysis of Gold for December 30,.2020 - Testing of the rising trendline and potential for upside continuation towards $1.896 2020-12-30 Prior 103.5; revised to 103.7 A slightly better reading than the previous month, which reflects some better optimism surrounding the economy. This is likely to do with vaccine optimism but we'll see how things play out as we get into the new year with the virus still rampant in the region. The data measures the future trends of overall economic activity in the Swiss economy. 
Further Development 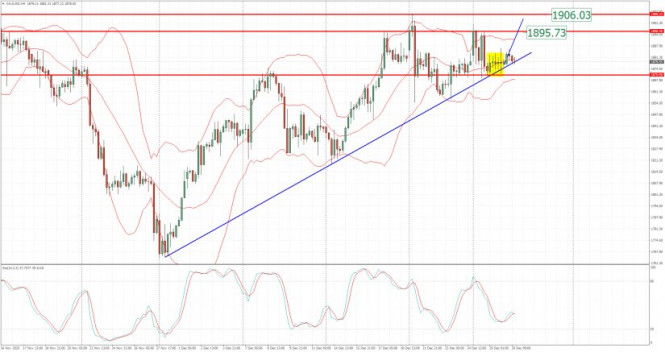
Analyzing the current trading chart of Gold, I found that there is test of the rising line at the price of $1,878. 1-Day relative strength performance Finviz 
Based on the graph above I found that on the top of the list we got Platinum and Orange Juice today and on the bottom Ethanol and VIX. Gold is neutral today... Key Levels: Resistance: $1,895 Support levels: $1,878 and $1,870 EUR/USD analysis for December 30 2020 - Breakout of the ascending triangle and potential for the bigger rise towards 1.2365 2020-12-30 Comments by UK health secretary, Matt Hancock We'll see about that. As the vaccines are being rolled out, it is easy for lawmakers to talk things up right now but delivering on those expectations will be another matter. In fact, the UK government has done a rather poor job on that front throughout the whole crisis so there's that to consider when reading into the remark by Hancock above. As for the latest on the AstraZeneca/Oxford vaccine, it is also one that requires two doses with the timing from the first to the second dose taking up to 12 weeks. Further Development 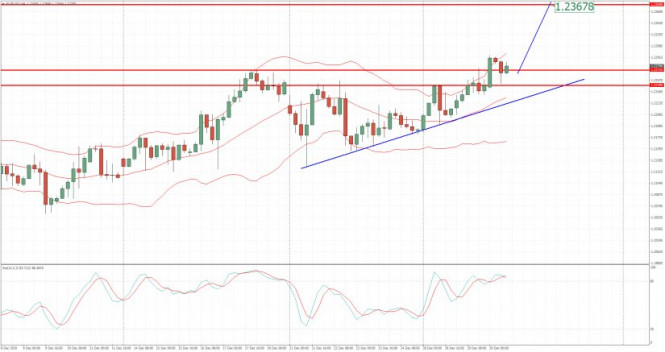
Analyzing the current trading chart of EURUSD, I found that there is the breakout of the ascending triangle on the 4H time-frame, which is sign for the further upside continuation. Watch for buying opportunities with the upside target at 1,2365. The trend is bullish and the longer time-frame money is bullish. 1-Day relative strength performance Finviz 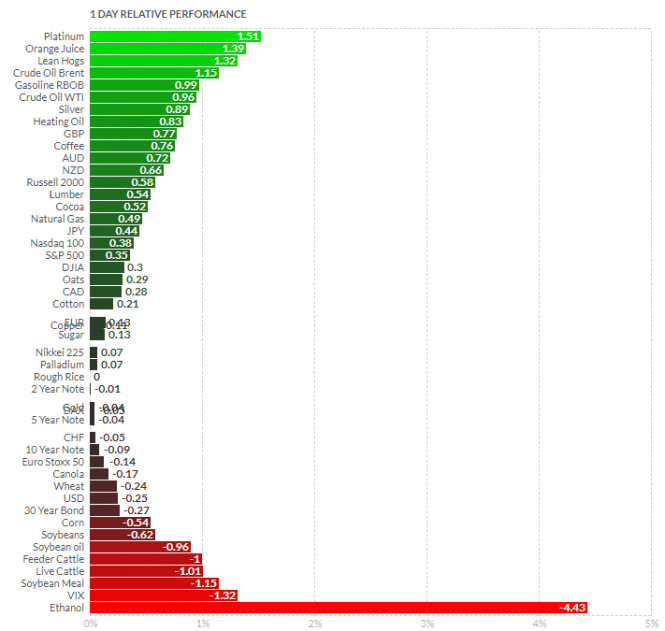
Based on the graph above I found that on the top of the list we got Platinum and Orange Juice today and on the bottom Ethanol and VIX. Key Levels: Resistance:1,2365 Support levels: 1,2270 and 1,2250
Author's today's articles: Igor Kovalyov  Igor Kovalyov was born on September 24, 1985. Igor graduated from Krasnoyarsk State University with a degree in Philology and Journalism. He has a wide experience as a newspaper and information agency correspondent. He got interested in financial markets in 2001. He also graduated from Moscow State University of Economics, Statistics, and Informatics (MESI) with a degree in Global Economics and then served as an analyst in an investment company. He has been working at InstaForex since 2014. Igor Kovalyov was born on September 24, 1985. Igor graduated from Krasnoyarsk State University with a degree in Philology and Journalism. He has a wide experience as a newspaper and information agency correspondent. He got interested in financial markets in 2001. He also graduated from Moscow State University of Economics, Statistics, and Informatics (MESI) with a degree in Global Economics and then served as an analyst in an investment company. He has been working at InstaForex since 2014. Sebastian Seliga  Sebastian Seliga was born on 13th Oсtober 1978 in Poland. He graduated in 2005 with MA in Social Psychology. He has worked for leading financial companies in Poland where he actively traded on NYSE, AMEX and NASDAQ exchanges. Sebastian started Forex trading in 2009 and mastered Elliott Wave Principle approach to the markets by developing and implementing his own trading strategies of Forex analysis. Since 2012, he has been writing analitical reviews based on EWP for blogs and for Forex websites and forums. He has developed several on-line projects devoted to Forex trading and investments. He is interested in slow cooking, stand-up comedy, guitar playing, reading and swimming. "Every battle is won before it is ever fought", Sun Tzu Sebastian Seliga was born on 13th Oсtober 1978 in Poland. He graduated in 2005 with MA in Social Psychology. He has worked for leading financial companies in Poland where he actively traded on NYSE, AMEX and NASDAQ exchanges. Sebastian started Forex trading in 2009 and mastered Elliott Wave Principle approach to the markets by developing and implementing his own trading strategies of Forex analysis. Since 2012, he has been writing analitical reviews based on EWP for blogs and for Forex websites and forums. He has developed several on-line projects devoted to Forex trading and investments. He is interested in slow cooking, stand-up comedy, guitar playing, reading and swimming. "Every battle is won before it is ever fought", Sun Tzu Ivan Aleksandrov  Ivan Aleksandrov Ivan Aleksandrov Zhizhko Nadezhda  Graduated from Irkutsk State University. Having acquainted with Forex market in 2008, followed the courses in the International Academy of Stock Exchange Trading. The agenda was so exiting that she moved to St. Petersburg in order to get professional education. Obtained a diploma of the retraining course on the discipline Exchange market and stock market issues, defended the graduation paper with distinction on the subject "Modern technical indicators as the basis of the trading system". At the moment obtains a master degree in International Banking Institute on specialty Financial markets and investments. Apart from trading is occupied with development of trading systems and formalization of the working strategies using Ichimoku indicator. At the moment is working on the book dedicated to the peculiarities of Ichimoku indicator and its operating methods. Interests: yoga, literature, travelling and photograph. "You can only get smarter by playing a smarter opponent" Basics of Chess play, 1883 "Successful people change by themselves, the others are changed by life" Jim Rohn Graduated from Irkutsk State University. Having acquainted with Forex market in 2008, followed the courses in the International Academy of Stock Exchange Trading. The agenda was so exiting that she moved to St. Petersburg in order to get professional education. Obtained a diploma of the retraining course on the discipline Exchange market and stock market issues, defended the graduation paper with distinction on the subject "Modern technical indicators as the basis of the trading system". At the moment obtains a master degree in International Banking Institute on specialty Financial markets and investments. Apart from trading is occupied with development of trading systems and formalization of the working strategies using Ichimoku indicator. At the moment is working on the book dedicated to the peculiarities of Ichimoku indicator and its operating methods. Interests: yoga, literature, travelling and photograph. "You can only get smarter by playing a smarter opponent" Basics of Chess play, 1883 "Successful people change by themselves, the others are changed by life" Jim Rohn Alexander Dneprovskiy  Graduated from Kiev State University of Economics. On Forex market since 2007. Started his work at Forex as a trader. Since 2008 is working as a currency analyst. Graduated from Kiev State University of Economics. On Forex market since 2007. Started his work at Forex as a trader. Since 2008 is working as a currency analyst. Mourad El Keddani  Was born in Oujda, Morocco. Currently lives in Belgium. In 2003 obtained B.S. in Experimental Sciences. In 2007 obtained a graduate diploma at Institut Marocain Specialise en Informatique Applique (IMSIA), specialty – Software Engineering Analyst. In 2007–2009 worked as teacher of computer services and trainer in a professional school specializing in computer technologies and accounting. In 2005 started Forex trading. Authored articles and analytical reviews on Forex market on Forex websites and forums. Since 2008 performs Forex market research, and develops and implements his own trading strategies of Forex analysis (especially in Forex Research & Analysis, Currency Forecast, and Recommendations and Analysis) that lies in: Numerical analysis: Probabilities, equations and techniques of applying Fibonacci levels. Classical analysis: Breakout strategy and trend indicators. Uses obtained skills to manage traders' accounts since 2009. In April 2009 was certified Financial Technician by the International Federation of Technical Analysts. Winner of several social work awards: Education Literacy and Non-Formal Education (in Literacy and Adult Education in The National Initiative for Human Development). Was born in Oujda, Morocco. Currently lives in Belgium. In 2003 obtained B.S. in Experimental Sciences. In 2007 obtained a graduate diploma at Institut Marocain Specialise en Informatique Applique (IMSIA), specialty – Software Engineering Analyst. In 2007–2009 worked as teacher of computer services and trainer in a professional school specializing in computer technologies and accounting. In 2005 started Forex trading. Authored articles and analytical reviews on Forex market on Forex websites and forums. Since 2008 performs Forex market research, and develops and implements his own trading strategies of Forex analysis (especially in Forex Research & Analysis, Currency Forecast, and Recommendations and Analysis) that lies in: Numerical analysis: Probabilities, equations and techniques of applying Fibonacci levels. Classical analysis: Breakout strategy and trend indicators. Uses obtained skills to manage traders' accounts since 2009. In April 2009 was certified Financial Technician by the International Federation of Technical Analysts. Winner of several social work awards: Education Literacy and Non-Formal Education (in Literacy and Adult Education in The National Initiative for Human Development).
Languages: Arabic, English, French and Dutch.
Interests: Algorithm, Graphics, Social work, Psychology and Philosophy. Petar Jacimovic  Petar was born on July 08, 1989 in Serbia. Graduated from Economy University and after has worked as a currency analyst for large private investors. Petar has been involved in the world of finance since 2007. In this trading he specializes in Volume Price Action (volume background, multi Fibonacci zones, trend channels, supply and demand). He also writes the market analytical reviews for Forex forums and websites. Moreover Petar is forex teacher and has wide experience in tutoring and conducting webinars. Interests : finance, travelling, sports, music "The key to success is hard work" Petar was born on July 08, 1989 in Serbia. Graduated from Economy University and after has worked as a currency analyst for large private investors. Petar has been involved in the world of finance since 2007. In this trading he specializes in Volume Price Action (volume background, multi Fibonacci zones, trend channels, supply and demand). He also writes the market analytical reviews for Forex forums and websites. Moreover Petar is forex teacher and has wide experience in tutoring and conducting webinars. Interests : finance, travelling, sports, music "The key to success is hard work"
Subscription's options management Theme's:
Fundamental analysis, Fractal analysis, Wave analysis, Technical analysis, Stock Markets
Author's :
A Zotova, Aleksey Almazov, Alexander Dneprovskiy, Alexandr Davidov, Alexandros Yfantis, Andrey Shevchenko, Arief Makmur, Dean Leo, Evgeny Klimov, Fedor Pavlov, Grigory Sokolov, I Belozerov, Igor Kovalyov, Irina Manzenko, Ivan Aleksandrov, l Kolesnikova, Maxim Magdalinin, Mihail Makarov, Mohamed Samy, Mourad El Keddani, Oleg Khmelevskiy, Oscar Ton, Pavel Vlasov, Petar Jacimovic, R Agafonov, S Doronina, Sebastian Seliga, Sergey Belyaev, Sergey Mityukov, Stanislav Polyanskiy, T Strelkova, Torben Melsted, V Isakov, Viktor Vasilevsky, Vladislav Tukhmenev, Vyacheslav Ognev, Yuriy Zaycev, Zhizhko Nadezhda
Edit data of subscription settings
Unsubscribe from the mailing list Sincerely,
Analysts Service | If you have any questions, you can make a phone call using one of the
InstaForex Toll free numbers right now:
|  | InstaForex Group is an international brand providing online trading services to the clients all over the world. InstaForex Group members include regulated companies in Europe, Russia and British Virgin Islands. This letter may contain personal information for access to your InstaForex trading account, so for the purpose of safety it is recommended to delete this data from the history. If you have received this letter by mistake, please contact InstaForex Customer Relations Department. |


No comments:
Post a Comment