| EUR/USD: plan for the European session on December 30. COT reports. Euro surpasses new annual highs, prepares to test 1.2303 2020-12-30 To open long positions on EUR/USD, you need: Yesterday there were several signals to enter the market, however, given the weak volatility, there was no normal movement in either direction. Let's take a look at the 5-minute chart and break down the trades. Even in my afternoon forecast, I pointed to a good signal to open short positions from the 1.2254 level. However, the decline from it was no more than 20 points. The bulls managed to settle above the 1.2254 level during the US session, but they failed to build strong growth from it either. The growth was around 20 points and it also ended quickly. I marked all entry points on the chart. 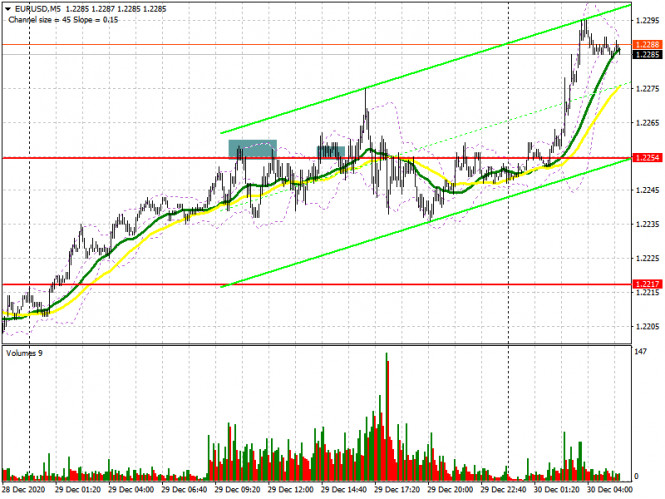
Today's Asian session was more interesting. Buyers have already come close to resistance at 1.2304. A breakout and consolidation above this level with a test from the bottom up creates a good signal to open long positions in order for EUR/USD to rise to highs of 1.2339 and 1.2417, where I recommend taking profits. In case the pair falls in the first half of the day, you can focus on support at 1.2267. However, forming a false breakout in that area creates a signal to open long positions in the euro. If the quote does not rapidly rise from this level, then it is best to abandon short positions until a low of 1.2236 has been updated, where you can buy the euro immediately on a rebound, counting on an upward correction of 20-25 points within the day. Larger lows are seen in the 1.2205 and 1.2174 areas. To open short positions on EUR/USD, you need: Sellers of the euro aim to regain control over the 1.2267 level, which they missed in today's Asian session. Getting the pair to settle below this range and testing it from the other side will raise the pressure on the pair, which creates a good entry point for short positions. In this case, the main goal is to pull down EUR/USD to the area of support at 1.2236, as well as to update a larger low around 1.2205, where I recommend taking profit. An equally important task is to protect a new annual high in the 1.2304 area, to which the pair is gradually approaching. Forming a false breakout there creates a good entry point for short positions in hopes for the pair to return to the support area of 1.2267. In case the bears are not active at the 1.2304 level, I recommend postponing short positions until the 1.2339 high has been tested and sell EUR/USD immediately on a rebound, counting on a correction of 20-25 points within the day. 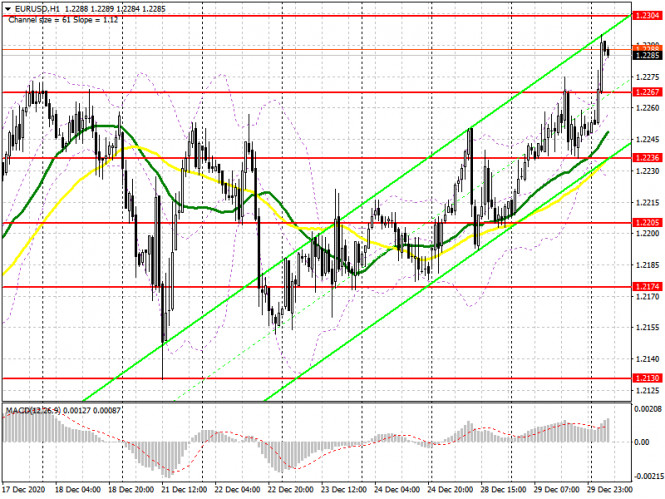
The Commitment of Traders (COT) report for December 21 recorded an increase in both short and long positions. Buyers of risky assets continue to believe in a bull market amid news that vaccination against the first strain of coronavirus has begun in Europe. However, due to the quarantine measures taken after the detection of a new strain of Covid-19 that appeared recently in the UK, there are still quite a few problems. Thus, long non-commercial positions rose from 218,710 to 222,443, while short non-commercial positions jumped from 76,877 to 78,541. The total non-commercial net position rose from 141,833 to 143,902 a week earlier. Delta growth has resumed, but is unlikely to continue at the end of this year, as trading volume will be rather low. Therefore, you should not count on the euro's rapid growth this week, although the low trading volume may lead to a surge in volatility. Indicator signals: Moving averages Trading is carried out above 30 and 50 moving averages, which indicates the euro's successive growth in the short term. Note: The period and prices of moving averages are considered by the author on the H1 hourly chart and differs from the general definition of the classic daily moving averages on the daily D1 chart. Bollinger Bands In case the pair falls, support will be provided by the middle border of the indicator in the 1.2265 area, or the lower border in the 1.2235 area. Description of indicators - Moving average (moving average, determines the current trend by smoothing out volatility and noise). Period 50. It is marked in yellow on the chart.
- Moving average (moving average, determines the current trend by smoothing out volatility and noise). Period 30. It is marked in green on the chart.
- MACD indicator (Moving Average Convergence/Divergence — convergence/divergence of moving averages) Quick EMA period 12. Slow EMA period to 26. SMA period 9
- Bollinger Bands (Bollinger Bands). Period 20
- Non-commercial speculative traders, such as individual traders, hedge funds, and large institutions that use the futures market for speculative purposes and meet certain requirements.
- Long non-commercial positions represent the total long open position of non-commercial traders.
- Short non-commercial positions represent the total short open position of non-commercial traders.
- Total non-commercial net position is the difference between short and long positions of non-commercial traders.
GBP/USD: plan for the European session on December 30. COT reports. Pound tries to return to annual highs amid US dollar's general weakness at the end of the year 2020-12-30 To open long positions on GBP/USD, you need: Yesterday, we did not have a single signal to enter the market, while the British pound's volatility remained at a fairly low level, and the pair failed to test the designated levels, from which one could make a decision to enter the market. 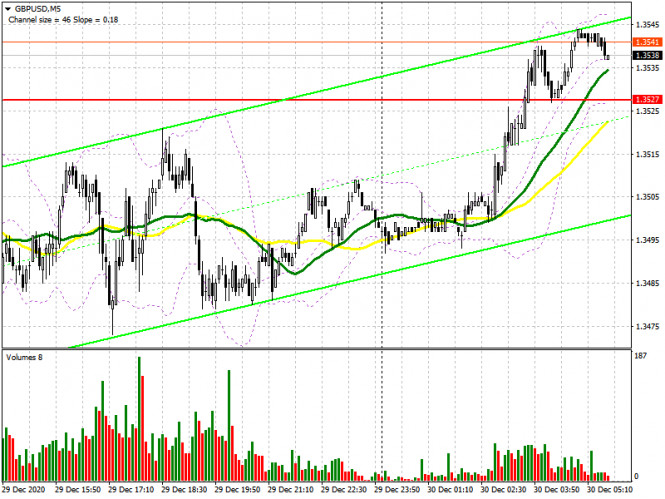
Buyers are currently focused on resistance at 1.3567. A breakout and consolidation at this level with a test from top to bottom creates a good entry point into sustaining the bull market. In this case, we can expect a larger upward movement to the high of 1.3615 along with an update and an exit to the 1.3690 area, where I recommend taking profits. If the pound is under pressure in the morning, then it is best to open long positions only when a false breakout has formed in the support area of 1.3516, where the moving averages are, playing on the side of those who buy the pound. I recommend buying GBP/USD immediately on a rebound from a low of 1.3475, or even lower, from a larger support area of 1.3433, counting on an upward correction of 25-30 points within the day. To open short positions on GBP/USD, you need: The dollar's weakness will continue to push the British pound. In this regard, it is best not to rush to sell GBP/USD today. Only a false breakout in the new resistance area of 1.3567, which was formed as a result of a sharp decline in the pair's volatility, will return pressure to the pound and lead to a downward correction to the support area of 1.3516, on which the succeeding direction depends. A breakout of this level and being able to test it from the bottom up creates a good signal to open short positions in sustaining the downward correction, in hopes for the pound to fall to lows of 1.3475 and 1.3404, which is where I recommend taking profits. In case the pound grows further, I recommend not rushing to sell. It is best to wait for the renewal of annual highs around 1.3615, where forming a false breakout will be a signal to open short positions. I recommend selling GBP/USD immediately on a rebound from a high of 1.3690, counting on a decrease of 25-30 points within the day. 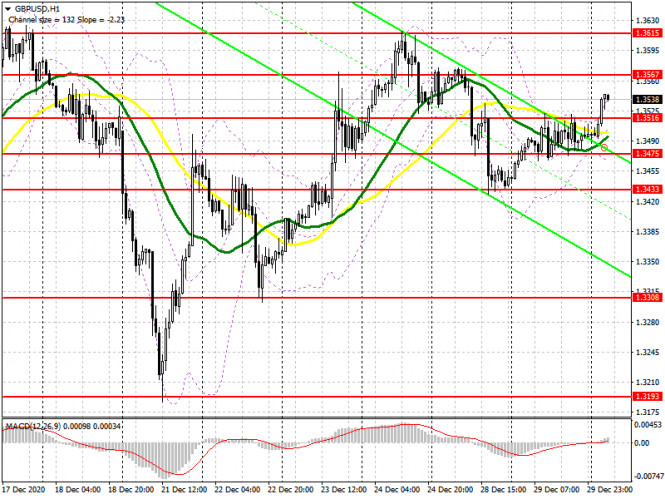
The Commitment of Traders (COT) reports for December 21 recorded an increase in interest in the British pound, both among buyers and sellers. Long non-commercial positions increased from 35,128 to 37,550. At the same time, short non-commercial remained practically unchanged and increased only from 31,060 to 31,518. As a result, the non-commercial net position remained positive and grew to 6,032, against 4,068 a week earlier. All this suggests that traders continue to bet on the pound's growth, even in the face of the new Covid-19 strain, which was first reported in the UK. Everyone believes in the vaccine and that the beginning of next year, as soon as the quarantine measures are lifted, will be associated with strong economic growth, which will give the market a new bullish impetus and cause the pound to update new annual highs. Additional stimulus from the Bank of England may somewhat smooth out the upward trend in the pound, but it may not be there, since the trade agreement with the EU was concluded at the very last moment. Indicator signals: Moving averages Trading is carried out in the area of 30 and 50 moving averages, which indicates the sideways nature of the market in the short term. Note: The period and prices of moving averages are considered by the author on the H1 hourly chart and differs from the general definition of the classic daily moving averages on the daily D1 chart. Bollinger Bands A breakout of the upper border of the indicator around 1.3620 will lead to a new wave of growth for the pound. A breakout of the lower boundary at 1.3510 will increase pressure on the pair. Description of indicators - Moving average (moving average, determines the current trend by smoothing out volatility and noise). Period 50. It is marked in yellow on the chart.
- Moving average (moving average, determines the current trend by smoothing out volatility and noise). Period 30. It is marked in green on the chart.
- MACD indicator (Moving Average Convergence/Divergence — convergence/divergence of moving averages) Quick EMA period 12. Slow EMA period to 26. SMA period 9
- Bollinger Bands (Bollinger Bands). Period 20
- Non-commercial speculative traders, such as individual traders, hedge funds, and large institutions that use the futures market for speculative purposes and meet certain requirements.
- Long non-commercial positions represent the total long open position of non-commercial traders.
- Short non-commercial positions represent the total short open position of non-commercial traders.
- Total non-commercial net position is the difference between short and long positions of non-commercial traders.
Indicator analysis. Daily review of EUR/USD for December 30, 2020 2020-12-30 The pair traded upward on Tuesday and tested 1.2275 - an 85.4% retracement level (yellow dashed line), closing slightly below 1.2247. Today, the market may continue to move up. As per the economic calendar, dollar news is expected at 15:00 and 15:30 UTC. Trend analysis (Fig. 1). The market may continue to move upward from the level of 1.21247 (closing of yesterday's daily candlestick) with the target at 1.2328 - the upper border of the Bollinger line indicator (black dotted line). Upon reaching this level, the upward trend may continue with the next target at the historical resistance level 1.2462 (blue dotted line). 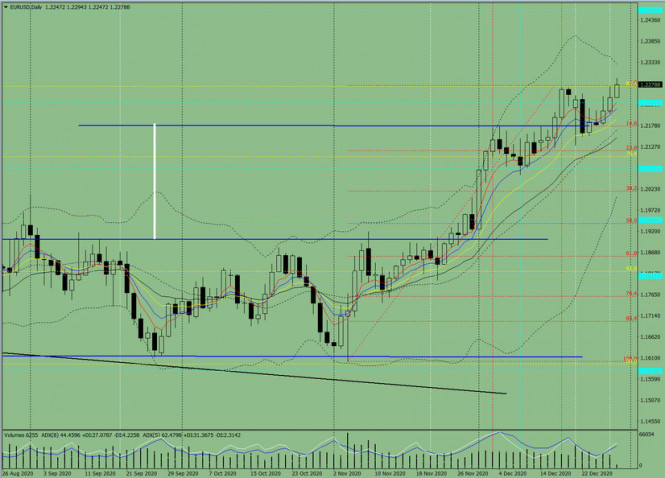
Figure: 1 (daily chart). Comprehensive analysis: - Indicator analysis - up; - Fibonacci levels - up; - Volumes - up; - Candlestick analysis - up; - Trend analysis - up; - Bollinger lines - up; - Weekly chart - up. General conclusion: Today, the price may continue to move upward with the target at 1.2328 - the upper border of the Bollinger line indicator (black dotted line). Upon reaching this level, the upward trend may continue with the next target at the historical resistance level 1.2462 (blue dotted line). Alternative scenario: upon reaching 1.2275 - an 85.4% retracement level (yellow dashed line), the price may start moving down to the support level 1.2177 (blue bold line). Technical Analysis of EUR/USD for December 30, 2020 2020-12-30 Technical Market Outlook: The EUR/USD pair has broken above the last swing high located at the level of 1.2272 and made a new swing high at the level of 1.2294 (at the time of writing the article). Nevertheless, the Broadening Wedge price pattern is still in progress, so please notice that this particular pattern is a trend reversal pattern, which indicates a possible correction on the Euro market soon. For now, the zone located between the levels of 1.2154 - 1.2177 remains the key demand zone for bulls and the zone located between the levels of 1.2250 - 1.2272 will now act as a support zone. The positive momentum supports the short-term bullish outlook as long as the demand zone is not clearly violated. The next target for bulls is seen at the level of 1.2555. Weekly Pivot Points: WR3 - 1.2368 WR2 - 1.2314 WR1 - 1.2240 Weekly Pivot - 1.2185 WS1 - 1.2118 WS2 - 1.2062 WS3 - 1.1987 Trading Recommendations: Since the middle of March 2020 the main trend is on EUR/USD pair has been up. This means any local corrections should be used to buy the dips until the key technical support is broken. The key long-term technical support is seen at the level of 1.1609. The key long-term technical resistance is seen at the level of 1.2555. 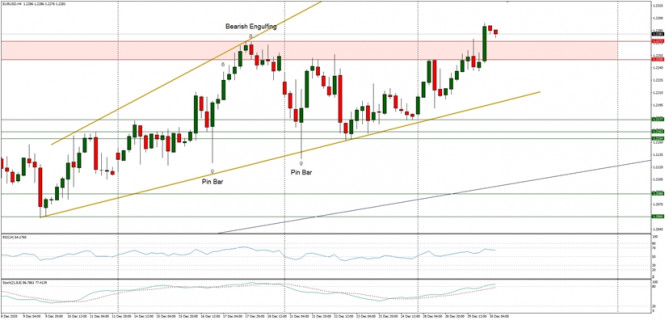
Technical Analysis of GBP/USD for December 30, 2020 2020-12-30 Technical Market Outlook: The GBP/USD pair has keeps trading in the middle of the consolidation zone as the volatility decreases. The local low during the recent the pull-back was made at the level of 1.3428 and will now act as an intraday support. Nevertheless, the bullish pressure is clear, and if the swing high is broken, then the next target is seen at the level of 1.3667 and 1.3708. Please notice, the market is coming off the overbought conditions, so a horizontal range trading might be still in progress. The momentum remains strong and positive, which supports the short term bullish outlook. Weekly Pivot Points: WR3 - 1.4170 WR2 - 1.3890 WR1 - 1.3745 Weekly Pivot - 1.3458 WS1 - 1.3319 WS2 - 1.3039 WS3 - 1.2880 Trading Recommendations: The GBP/USD pair might have started a long term up trend and the trigger for this trend was the breakout above the level or 1.3518 on the weekly time frame chart. All the local corrections should be used to enter a buy orders as long as the level of 1.2674 is not broken. The long-term target for bulls is seen at the level of 1.4370. 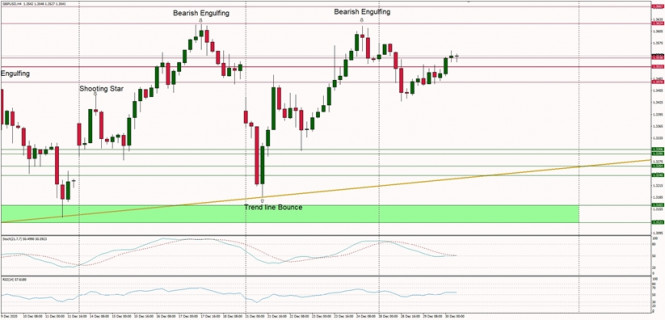
Indicator analysis. Daily review of GBP/USD for December 30, 2020 2020-12-30 The pair traded upward on Tuesday and broke through the historical resistance level 1.3481 (blue dotted line). Today, the price may continue to move upward. As per the economic calendar, dollar news is expected at 15:00 and 15:30 UTC. Trend analysis (Fig. 1). The market may continue to move upward from the level of 1.3496 (closing of yesterday's daily candlestick) with the target at the upper fractal 1.3623 (red dotted line) - a daily candlestick from 12/17/2020. In case of testing this level, the upward trend may continue with the next target of 1.3676 - a 76.4% retracement level (yellow dashed line). 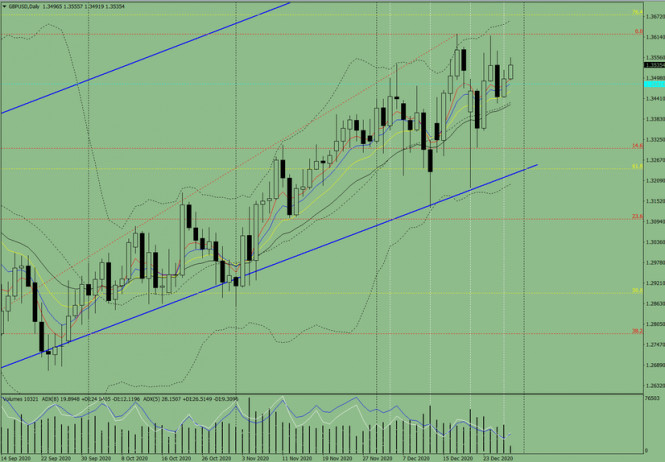
Figure: 1 (daily chart). Comprehensive analysis: - Indicator analysis - up; - Fibonacci levels - up; - Volumes - up; - Candlestick analysis - up; - Trend analysis - up; - Bollinger lines - up; - Weekly chart - up. General conclusion: Today, the price may continue to move upward from the level of 1.3496 (closing of yesterday's daily candlestick) with the target at the upper fractal 1.3623 (red dotted line) - the daily candle from 12/17/2020. In case of testing this level, the upward trend may continue with the next target of 1.3676 - a 76.4% retracement level (yellow dashed line). Alternative scenario: the price may continue to move upward from the level of 1.3496 (closing of yesterday's daily candlestick) with the target at the upper fractal 1.3623 (red dotted line) - the daily candle from 12/17/2020. In case of testing this level, a downward trend is possible with the target at the historical support level 1.3481 (blue dotted line). AUD/USD. Iron ore's records and US dollar's vulnerability 2020-12-30 The Australian dollar is ending this year positively. It managed to update its multi-month high and reached the level of 0.7664 before the New Year's holiday. The last time the AUD/USD pair was at such price highs was in April 2018. Now, buyers clearly intend to test the price level of 0.77 in the near future, indicating the nearest prospects. On the one hand, current price fluctuations should be treated with a certain degree of caution, since traders trade in conditions of low liquidity. It should be noted that a narrow market increases the sensitivity of currency pairs – even a minor information can provoke increased volatility. On the other hand, the current growth of the Australian dollar fits accordingly into the general outline of the latest trends. Let's take the AUD/USD weekly chart as an example: Since November started, the pair has been growing almost without pullback, rising by almost 700 points in two months. Therefore, the investors should not be confused with the pre-New Year growth of the Australian dollar, which continues to gain impulse amid a weakening US dollar. 
The upward trend of the AUD/USD pair is primarily due to the growth of the commodity market and the general demand for risky assets. Moreover, the current optimism in the market is putting pressure on the US currency: the US dollar index declined below the 90th mark again, reflecting another massive sell-off. Now, let's start with events in the US. It can be recalled that Donald Trump approved a stimulus package totaling $ 900 billion on Monday. Despite criticizing this bill, he still signed the document, while asking congressmen to increase the amount of direct payments to Americans, that is, from $ 600 to $ 2,000. Oddly enough, the Congressmen listened to the President's requests and voted for the corresponding amendment. This is that rare moment when Trump's position coincided with the position of the representatives of the Democratic Party. However, the above amendment has so far been approved by the Lower House of Congress only – the House of Representatives. The Democrats are the majority there, while on the contrary, the Republicans are the majority in the Senate. The Upper House of Congress decided not to rush to a vote, postponing the issue until January. However, this fact did not disappoint investors: the markets are still dominated by optimistic sentiment, as proven by the key indices of the US stock market. The Australian dollar, in turn, is receiving additional support from the commodity market. Last week, iron ore rose to nine-year highs, while on Monday, the price of a strategically important raw material for the Australian economy rose by almost $ 177 per tonne. At the moment, this indicator has slightly reduced, but it still has an upward dynamic. Since the beginning of the year, iron ore has almost doubled in price. Experts believe that its price will continue to grow in the first half of next year due to several factors: For example, Brazil significantly reduced ore exports (including due to the collapse at the Vale mine). At the same time, Brazil is the second largest global exporter of this raw material after Australia. In turn, the rainy season begins in Australia – due to adverse weather conditions, production at the mines is limited. Additionally, the tense relations between Beijing and Canberra also plays a vital role. There are rumors circulating in the market that China may introduce a tax next year that can be levied on the supply of Australian iron ore. Amid such (possible) prospects, Chinese industrialists are creating additional reserves of raw materials as soon as possible. The current fundamental picture pushes the AUD/USD pair up to new heights. The narrow market only strengthens the upward dynamics, allowing buyers to open the next price ranges. This trend will continue in the medium-term, especially given the vulnerability of the US currency. 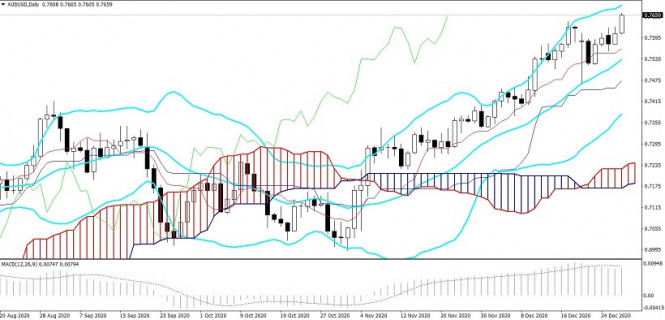
In other words, the upward trend of the AUD/USD pair is still in force. From a technical point of view, the pair on all higher time frames (from H4 and above) is either on the upper line of the Bollinger Bands indicator or between the middle and upper lines, which indicates the priority of the upward direction. Meanwhile, the Ichimoku indicator in time frames from H4 to W1 (except for the monthly chart) formed a bullish signal "Parade of Lines" when the price is above all the indicator lines, including above the Kumo cloud. This signal indicates a bullish mood. The strongest resistance is at 0.7700 – upper Bollinger Bands line on the daily TF. It is important for buyers to break through this target in order to consolidate within the level of 0.77 and plan future prospects. EUR/USD and GBP/USD: Democrats continue to insist on a $2,000 additional payment to Americans. The UK parliament is expected to approve the Brexit trade deal today. 2020-12-30 Heated debates continue in the US House of Representatives, as Democrats are still actively promoting their stance, which is to increase payments to Americans. According to latest reports, the lower house approved the bill to increase payments up to $ 2,000 per person. However, they will only apply to those with an annual income below 75,000. The new bill was passed by a majority of 275 votes to 134 votes, and even received support from 44 Republicans. Such payments will cost the Treasury $ 464 billion. Immediately thereafter, Senate Minority Leader Chuck Schumer called on President Donald Trump to convince Republican Senators to vote for a raise, but that did not happen. 
Senate Majority Leader Mitch McConnell objected to the bill on Tuesday, which prompted Trump to tweet again, urging Republicans to accept larger stimulus payments. In the meantime, the US Internal Revenue Service started to distribute $ 600 payment to Americans who meet the required criteria. The first payouts will go to low and middle-income Americans. Dependent children aged 16 and under, which are also from these families, are eligible as well. With regards to the EUR / USD pair, the euro reached a new yearly high this week, probably because demand for the dollar continues to decrease amid rumors that the US Fed may resort to new stimulus measures next year, as well as change its monetary policy ... Aside from that, the EU parliament has temporarily approved the Brexit trade deal, in which, according to the reports, the member states of the European Union gave an official response and formally supported the agreement concluded last week. Now, all that is left is the approval of the UK parliament, which is expected today. If the bill is ratified, it will come into force starting January 1, 2021. The final vote of the EU parliament on this document is scheduled for March 2021. 
About the state of the economies, the Redbook recently reported that retail sales in the US rose by 8.9% in the week of Dec 20-26, and jumped by 0.4% in the first 4 weeks of December. The data published by S&P / CoreLogic / Case-Shiller, meanwhile, indicated that the national house price index increased by 8.4% in October, after rising by 7% in September. Economists had expected prices to rise by only 6.9%. Going back to the EUR/USD pair, the breakout of the 23rd figure will lead to a new wave of growth in risky assets, in particular, a sharp upward move towards 1.2350 and 1.2405. But if the quote returns to 1.2265, the euro will collapse to 1.223,5 and then to 1.2200. As for the GBP/USD pair, most likely, the quote will climb above 1.3565, however, such a move will slightly slow down the bull market. Nonetheless, the target is still 1.3620. But if the quote moves below 13515 instead, the pound will drop to 1.3435, and then to 1.3310. Trading recommendations for starters on GBP/USD and EUR/USD for December 30, 2020 2020-12-30 Yesterday's trading was not unusual for the market, since everything followed the planned scenario. So, US statistics were the only data that was published, where the S&P/Case-Shiller house price index rose from 6.6% to 7.9%, which is more than expected. However, the market did not react to the positive statistics, as traders are still focused on the Brexit results, and trading volumes have been reduced in connection with the preparation for the end of the year. What happened on the trading charts? The pound sterling rebounded from the variable support level of 1.3428, but there were only enough buyers for the Asian session. Since the beginning of the European session, the market has been affected by a sideways move of 1.3470/1.3520, which ended the trading day. The Euro was more active compared with the pound. Market participants were developing an upward trend, and as a result, the quote approached the local high (1.2275) of the medium-term upward trend, where a local stop with a slight pullback occurred. 
Trading recommendation for GBP/USD on December 30 The economic calendar is practically empty today. The only news is the data on unfinished sales in the real estate market in the United States, but only few will be interested. In terms of price movements, an upward move occurred during the opening of the Asian session, which broke through the upper limit of the side channel 1.3470/1.3520. It can be assumed that holding the price above the level of 1.3560 will lead to a subsequent increase towards the local high of 1.3618. An alternative scenario considers deceleration at current levels, followed by the formation of an amplitude of 1.3500/1.3550. 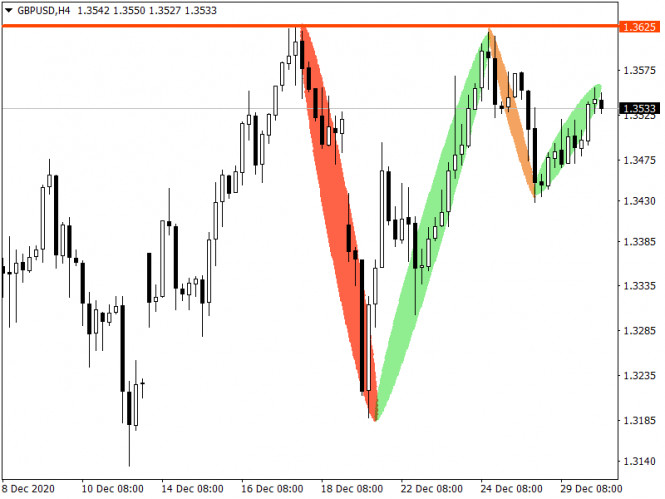
Trading recommendation for EUR/USD on December 30 Significant statistics are also not expected in Europe. Therefore, the primary focus will be on technical analysis. After the recent price fluctuations, it can be seen that the quote of the EUR/USD pair re-updated the local high of the medium-term upward trend. Before it, there is an important range of 1.2300/1.2500, where a stop occurred in 2018. This was followed by a change in the trend. It can be assumed that the price area of 1.2300/1.2500 will continue to put pressure on buyers, which may eventually lead to a large-scale correctional movement for the euro. 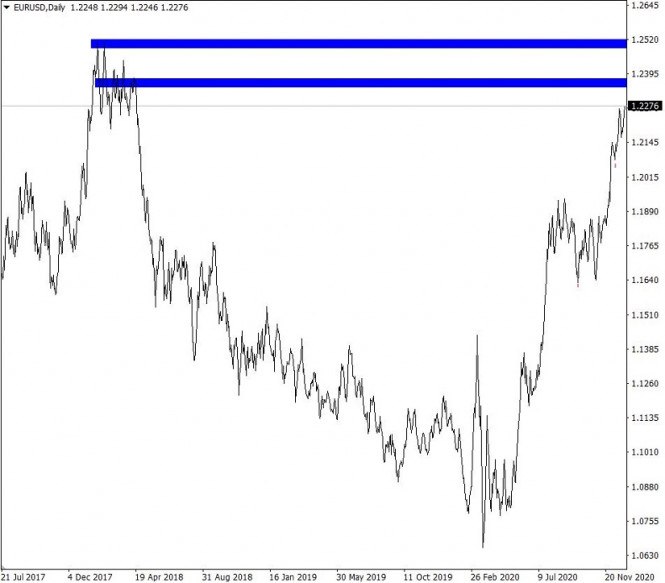
Trading plan for the EUR/USD pair on December 30. COVID-19 is attacking again. 2020-12-30 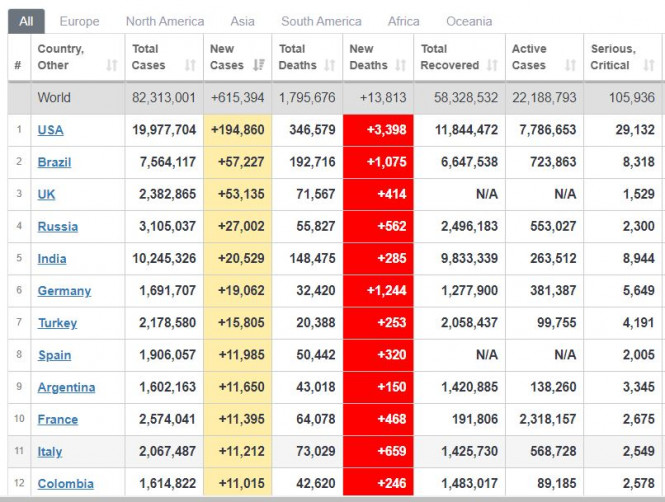
Global COVID-19 incidence jumped sharply after Christmas, having recorded 615,000 new cases yesterday, so much higher than the figures seen a couple of days ago. Previously, there were only 410,000 new cases. In the United States, patients increased by 200,000, while in the UK, it climbed by 53,000. On the bright side, vaccinations are active in the US, UK and the EU. 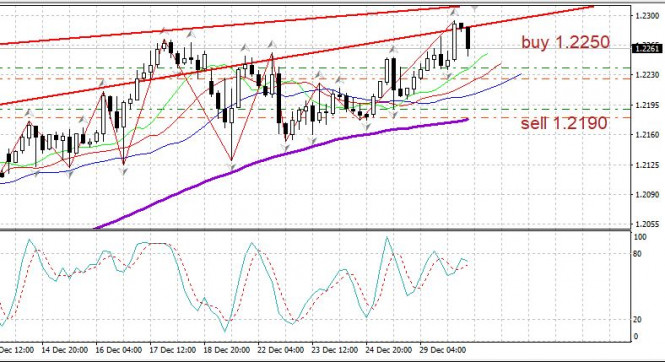
EUR/USD - euro continues to climb up. Open long positions from 1.2190. In case of a pullback, set up positions at 1.2180.
Author's today's articles: Maxim Magdalinin  In 2005 graduated from the Academy of the Ministry of Internal Affairs of the Republic of Belarus, law faculty. Worked as a lawyer for three years in one of the biggest country's company. Besides the trading, he develops trading systems, writes articles and analytical reviews. Works at stock and commodity markets explorations. On Forex since 2006. In 2005 graduated from the Academy of the Ministry of Internal Affairs of the Republic of Belarus, law faculty. Worked as a lawyer for three years in one of the biggest country's company. Besides the trading, he develops trading systems, writes articles and analytical reviews. Works at stock and commodity markets explorations. On Forex since 2006. Sergey Belyaev  Born December 1, 1955. In 1993 graduated from Air Force Engineering Academy. In September 1999 started to study Forex markets. Since 2002 has been reading lectures on the technical analysis . Is fond of research work. Created a personal trading system based on the indicator analysis. Authored the book on technical analysis "Calculation of the next candlestick". At present the next book is being prepared for publishing "Indicator Analysis of Forex Market. Trading System Encyclopedia". Has created eleven courses on indicator analysis. Uses classical indicators. Works as a public lecturer. Held numerous seminars and workshops presented at international exhibitions of financial markets industry. Is known as one of the best specialists in the Russian Federation researching indicator analysis. Born December 1, 1955. In 1993 graduated from Air Force Engineering Academy. In September 1999 started to study Forex markets. Since 2002 has been reading lectures on the technical analysis . Is fond of research work. Created a personal trading system based on the indicator analysis. Authored the book on technical analysis "Calculation of the next candlestick". At present the next book is being prepared for publishing "Indicator Analysis of Forex Market. Trading System Encyclopedia". Has created eleven courses on indicator analysis. Uses classical indicators. Works as a public lecturer. Held numerous seminars and workshops presented at international exhibitions of financial markets industry. Is known as one of the best specialists in the Russian Federation researching indicator analysis. Sebastian Seliga  Sebastian Seliga was born on 13th Oсtober 1978 in Poland. He graduated in 2005 with MA in Social Psychology. He has worked for leading financial companies in Poland where he actively traded on NYSE, AMEX and NASDAQ exchanges. Sebastian started Forex trading in 2009 and mastered Elliott Wave Principle approach to the markets by developing and implementing his own trading strategies of Forex analysis. Since 2012, he has been writing analitical reviews based on EWP for blogs and for Forex websites and forums. He has developed several on-line projects devoted to Forex trading and investments. He is interested in slow cooking, stand-up comedy, guitar playing, reading and swimming. "Every battle is won before it is ever fought", Sun Tzu Sebastian Seliga was born on 13th Oсtober 1978 in Poland. He graduated in 2005 with MA in Social Psychology. He has worked for leading financial companies in Poland where he actively traded on NYSE, AMEX and NASDAQ exchanges. Sebastian started Forex trading in 2009 and mastered Elliott Wave Principle approach to the markets by developing and implementing his own trading strategies of Forex analysis. Since 2012, he has been writing analitical reviews based on EWP for blogs and for Forex websites and forums. He has developed several on-line projects devoted to Forex trading and investments. He is interested in slow cooking, stand-up comedy, guitar playing, reading and swimming. "Every battle is won before it is ever fought", Sun Tzu Irina Manzenko  Irina Manzenko Irina Manzenko Pavel Vlasov  No data No data Vladislav Tukhmenev  Vladislav graduated from Moscow State University of Technologiy and Management. He entered the forex market in early 2008. Vladislav is a professional trader, analyst, and manager. He applies a whole gamut of analysis – technical, graphical, mathematical, fundamental, and candlestick analysis. Moreover, he forecasts the market movements using his own methods based on the chaos theory. Vladimir took part in development of trading systems devoted to fractal analysis. In his free time, Vladimir blogs about exchange markets. Hobbies: active leisure, sporting shooting, cars, design, and marketing. "I do not dream only of becoming the best in my field. I also dream about those who I will take with me along the way up." Vladislav graduated from Moscow State University of Technologiy and Management. He entered the forex market in early 2008. Vladislav is a professional trader, analyst, and manager. He applies a whole gamut of analysis – technical, graphical, mathematical, fundamental, and candlestick analysis. Moreover, he forecasts the market movements using his own methods based on the chaos theory. Vladimir took part in development of trading systems devoted to fractal analysis. In his free time, Vladimir blogs about exchange markets. Hobbies: active leisure, sporting shooting, cars, design, and marketing. "I do not dream only of becoming the best in my field. I also dream about those who I will take with me along the way up." Mihail Makarov  - -
Subscription's options management Theme's:
Fundamental analysis, Fractal analysis, Wave analysis, Technical analysis, Stock Markets
Author's :
A Zotova, Aleksey Almazov, Alexander Dneprovskiy, Alexandr Davidov, Alexandros Yfantis, Andrey Shevchenko, Arief Makmur, Dean Leo, Evgeny Klimov, Fedor Pavlov, Grigory Sokolov, I Belozerov, Igor Kovalyov, Irina Manzenko, Ivan Aleksandrov, l Kolesnikova, Maxim Magdalinin, Mihail Makarov, Mohamed Samy, Mourad El Keddani, Oleg Khmelevskiy, Oscar Ton, Pavel Vlasov, Petar Jacimovic, R Agafonov, S Doronina, Sebastian Seliga, Sergey Belyaev, Sergey Mityukov, Stanislav Polyanskiy, T Strelkova, Torben Melsted, V Isakov, Viktor Vasilevsky, Vladislav Tukhmenev, Vyacheslav Ognev, Yuriy Zaycev, Zhizhko Nadezhda
Edit data of subscription settings
Unsubscribe from the mailing list Sincerely,
Analysts Service | If you have any questions, you can make a phone call using one of the
InstaForex Toll free numbers right now:
|  | InstaForex Group is an international brand providing online trading services to the clients all over the world. InstaForex Group members include regulated companies in Europe, Russia and British Virgin Islands. This letter may contain personal information for access to your InstaForex trading account, so for the purpose of safety it is recommended to delete this data from the history. If you have received this letter by mistake, please contact InstaForex Customer Relations Department. |


No comments:
Post a Comment