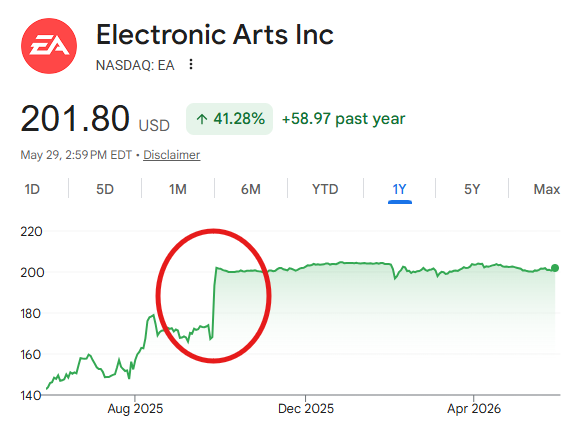
That's a clear move. But since then, it's been grinding sideways and even slightly lower. Five straight days of losses following the May 5th earnings report. Volume picking up on the down days. The stock sitting near the bottom of a narrow, horizontal channel. That's not a bullish trend. That's a trend that's exhausted (like anyone who’s played the same, recycled version of Madden for the last decade) waiting for a catalyst to pick a direction. And the direction it picks is going to matter a lot for options traders. The Pattern Is Right There This is where it gets interesting. EA just reported earnings on May 5th and missed badly. EPS came in at $1.59 against a $2.25 consensus estimate, a 29% miss. And this wasn't the first time. In Q1, the company missed by 37%. Two consecutive flops (do I really need to reference Madden again?). Now look at the chart structure. You've got a stock that ran hard on deal news, consolidated into a tight range between roughly $199 and $202, and just got hit with back-to-back earnings disappointments. That's a bearish consolidation pattern… a coiling spring that keeps getting compressed by negative fundamental news. I always tell people: if you can see the pattern in five seconds, it's real. If you have to squint and imagine it, walk away. I don't have to squint here. The pattern is a tight descending range on deteriorating earnings momentum. The Squeeze Is Building Here's what I love most about this setup. That tight $199–$202 range is volatility getting crushed. When price compresses like that, especially after a big news event like an earnings miss, the TTM Squeeze indicator starts stacking those red dots. The spring is loading... The question is: which way does it fire? With EA, you've got two forces pulling in opposite directions. The $210 buyout price is a ceiling. It limits upside because no rational buyer pays more than the deal price. But the earnings misses, the Battlefield engagement dropping post-launch, and the mobile business struggling, create real downside pressure if the deal hits a snag. The Committee on Foreign Investment in the United States (CFIUS) national security review, the last remaining regulatory hurdle, has an outside date of September 28, 2026. That's your wildcard. Any headline suggesting that review is getting complicated snaps the spring lower hard and fast. Your Action Plan This is an intermediate TPS setup. Not a clean A+ signal… that’s why I’m just watching it for now. The deal mechanics add a layer of complexity you don't get with a pure momentum trade. But the trend, pattern, and squeeze boxes all check. I'm watching the $199 support level closely. A clean break below that, especially on deal uncertainty headlines, and this squeeze fires with conviction. The buyout spread trade is the obvious play, but I prefer the one the chart is quietly setting up. Speaking of quiet setups, Bryan’s Stock Flip Scanner has been quietly positioning members into gains up to 667% overnight. He’s hitting these trades at a clip of 87% this year. Click here to make sure you get the next one. |


Post a Comment
0Comments