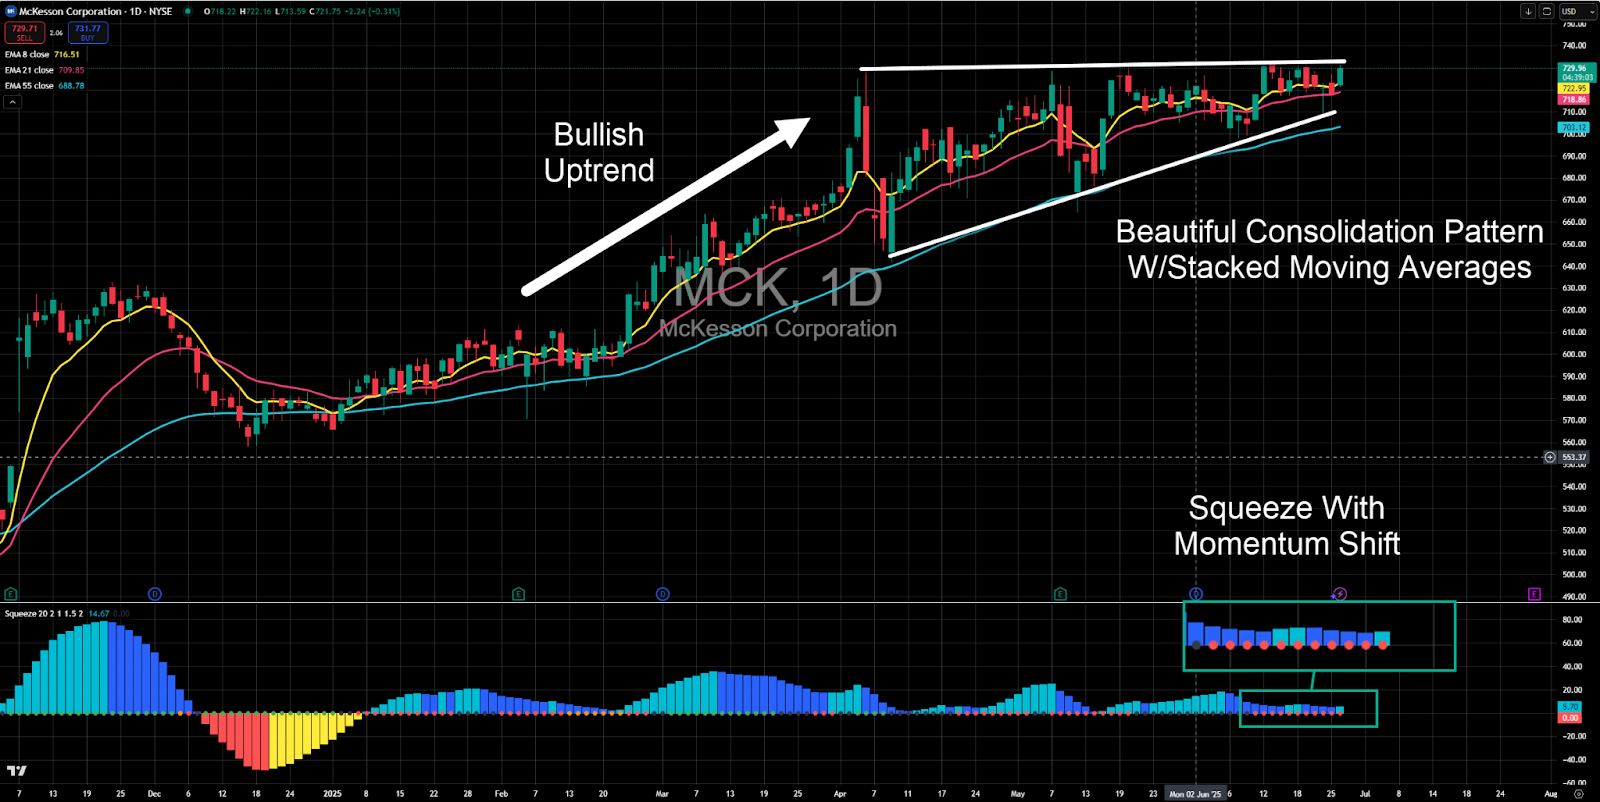
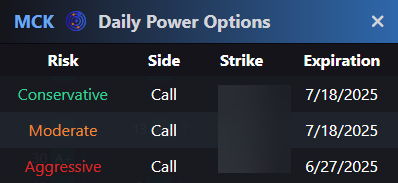
Nate Bear, Lead Technical Tactician, Monument Traders Alliance Hey Gang, I know many traders are struggling to find quality setups in this choppy, range-bound market. And no one wants to miss out on the next leg higher or be caught in a downdraft. But here's the solution: McKesson Corporation (MCK) is quietly setting up one of the most compelling technical patterns I've seen in weeks. The daily chart displays a perfect combination of a bullish trend, a tight consolidation pattern, and building momentum, which has me paying close attention. Here's why this matters: when strong stocks consolidate near their highs instead of selling off, it often signals that bigger moves are coming. Let me walk you through exactly what I'm seeing on MCK's chart and why this setup has all the ingredients for a powerful move higher. My Case for McKesson I want you to take a look at the daily chart I marked up for McKesson: No one can deny this stock is in a clear uptrend. Pullbacks are shallow. Even the latest consolidation pattern creates a clean trendline that follows the 55-period exponential moving average (EMA). At the same time, shares haven't broken through $730, though they have teased multiple times. This is a classic A+ TPS setup. The strong uptrend, combined with the lovely consolidation pattern, and a nice, long squeeze at the bottom with a momentum shift higher, all signal a potential breakout in the making. Plus, you've got the 8, 21, and 55-period EMAs all stacked on top of one another. My Trading Plan First, we need to recognize that we're working with the daily chart. That means this setup can take several weeks to complete. In our S.A.M. AI scanner, the Daily Power Options tool offers a few option ideas for us to try based on risk tolerance: Near-term expirations give you more bang for your buck, but come with higher risk of failure. I like the 7/18 expiration date which gives the setup a few weeks to work. | 


Post a Comment
0Comments