

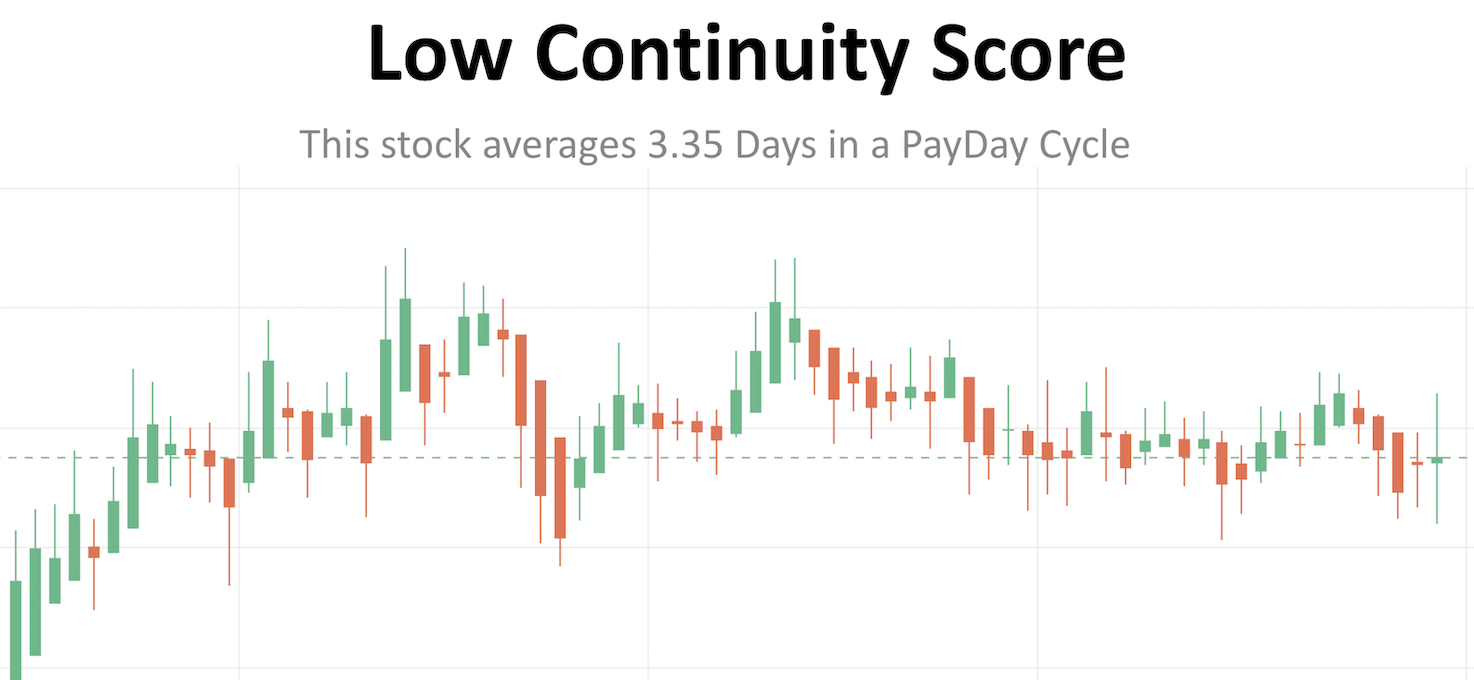
| Hey there, it’s Micah here with Part 2 of the The 10X Option SetUp! *If you missed part 1 check your email from yesterday, thanks in advance and enjoy… Part #2 - Next up is how I find the best stocks and DOJIs to trade. To do this I created two scoring systems. One for the stock and one for the DOJI. My Stock Score <> Continuity Score This shows me the typical length of a stock’s PayDay Cycle, based on its history.
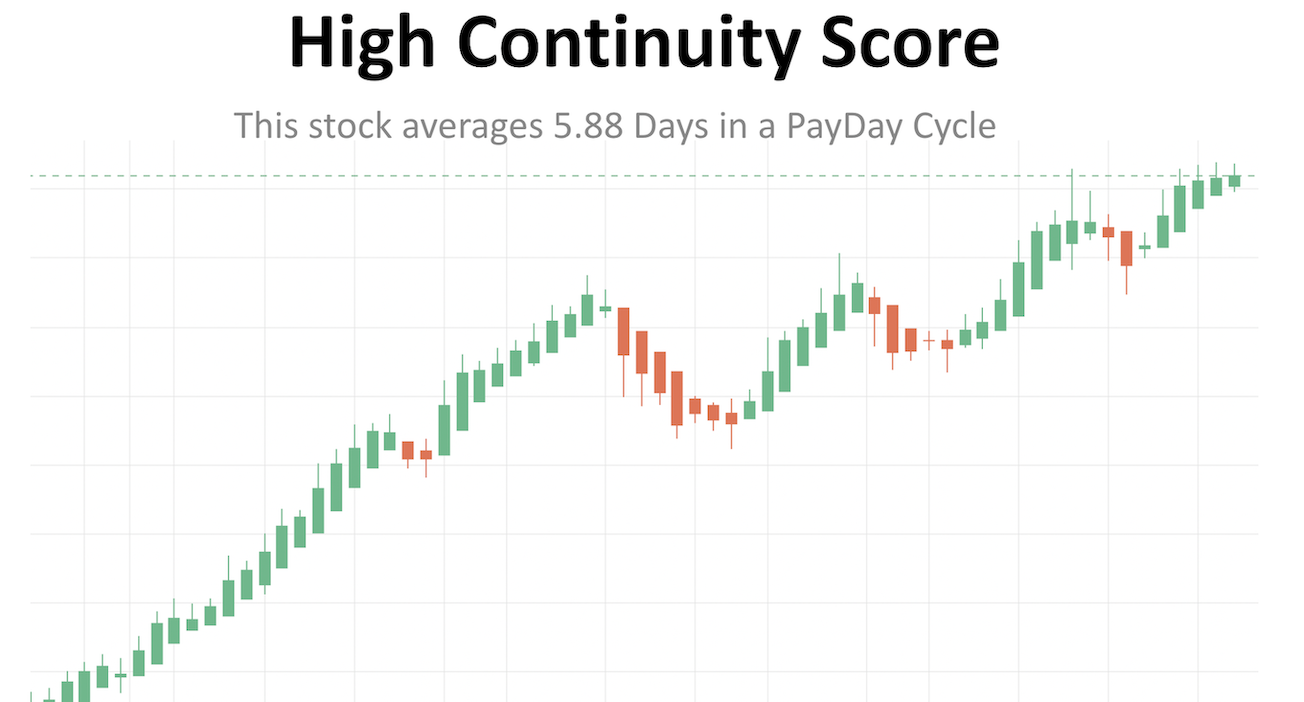
Here is the difference visually between a low continuity stock vs a high one…
The difference for me is really night and day but in case you need more convincing here’s 4 more Benefits to trading high Continuity stocks…
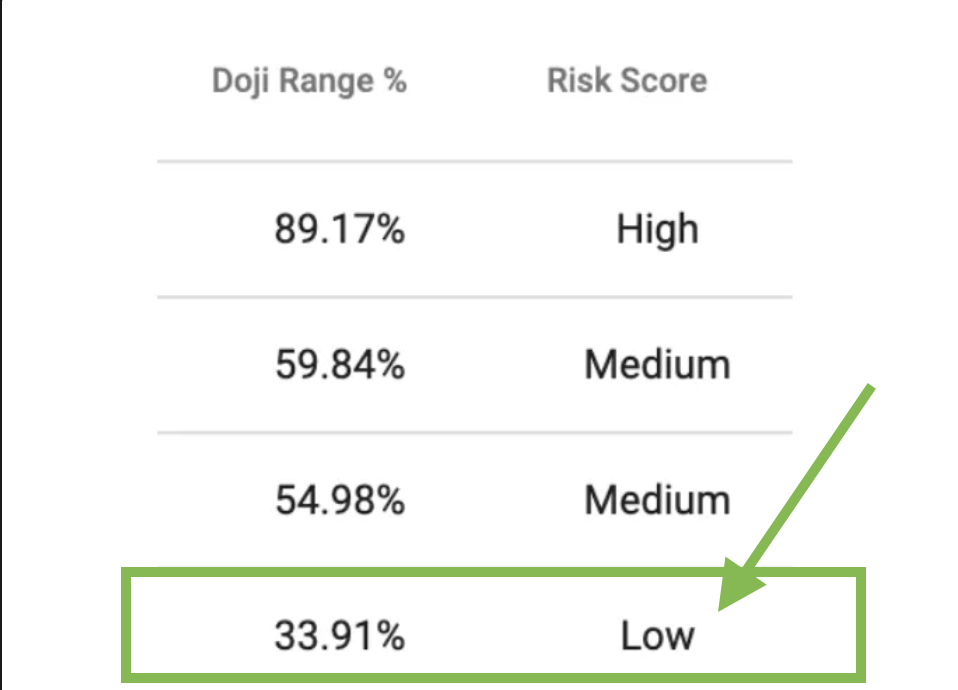
Understanding a stock’s Continuity with its average payday cycle days gives me a smarter way to hold winners longer and with a DOJI at the start its really a great way to stack the probability in my favor. My DOJI Score <> Risk Score Great traders don’t just look for high rewards, they look for low, asymmetrical risk setups. That’s why I created a Risk Score to help me categorize DOJI setups as LOW, MEDIUM, or HIGH risk before taking action. How I measure RISK in a DOJI? My DOJI risk score measures the size of the current DOJI against the stocks historical daily trading range. The calculation uses the size of the DOJI divided into the stocks 14 day ATR (Average True Range). Why It Matters LOW Risk = tighter stop = less capital at risk. MEDIUM Risk = balanced tradeoff. HIGH Risk = wider stop, position size down or skip the trade. Pro Tip #1 - I focus on LOW Risk setups first. These happen when the size of the DOJI is less than 50% the stocks normal daily range ATR. Here’s how what a low risk setup looks like in my DOJI screener.
Let’s recap:
This is how you get locked into the DOJI Strategy. Trade On, PS. Tomorrow I’ll send over my new training video that will walk you through the options part of this strategy. The DOJI is the entry, it’s the signal, the option is how you lever up. Until then… have a great weekend!
Micah Lamar Questions? Please email us at Support@WallStreet.io or Chat with us 1-on-1 at WallStreet.io WallStreet.io All Rights Reserved © 2024 Thank you for being a part of our community. Please use the social links below and spread the word. We appreciate you! Thanks in advance.
|
Post a Comment
0Comments