| Forecast and trading signals for EUR/USD on December 7. COT report. Analysis of Friday. Recommendations for Monday 2020-12-07 EUR/USD 15M 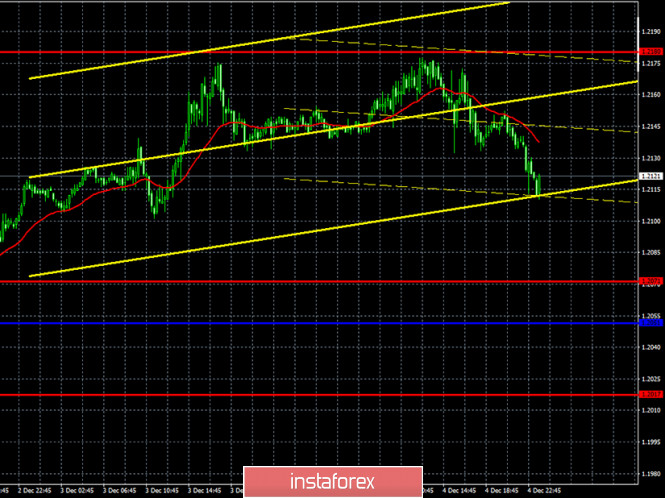 Both linear regression channels began to turn to the downside on the 15-minute timeframe, so the pair has a good chance of starting a noticeable downward correction. We are waiting for the quotes to fall, at least to the Kijun-sen line, near the area where the pair's fate will be decided. EUR/USD 1H 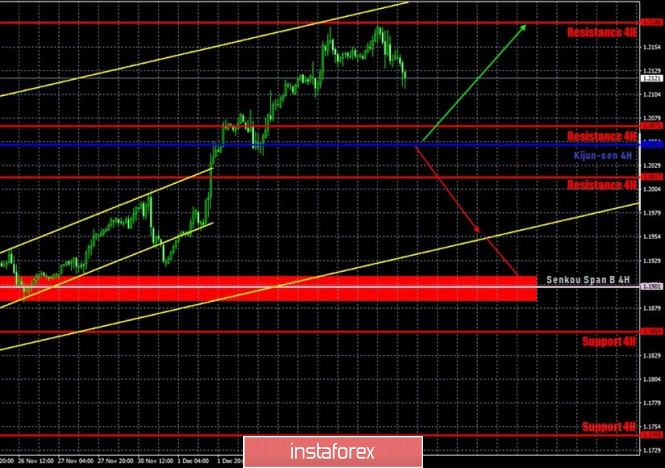 The EUR/USD pair tried to reach the resistance level of 1.2180 on the hourly timeframe on Friday, December 4. However, we did not reach this level by just a point. However, we believe that this level has been reached twice. However, the pair and those who trade this pair still have problems. The upward trend is clearly visible, which is good. Since trading in a trend is always more pleasant than doing so in a flat or in an incomprehensible movement. However, the price has been constantly forming false breakouts and breakouts lately. All small trend lines and channels have been canceled. As a result, we only one have one at our disposal, the global rising channel, which dates back to November 4th. The pair's quotes are now in the upper area of this channel. Logically, after two unsuccessful attempts to overcome the 1.2180 level, now the pair should fall. However, the upward trend will still be present above the critical Kijun-sen line. Therefore, we advise you not to rush to sell the pair. COT report 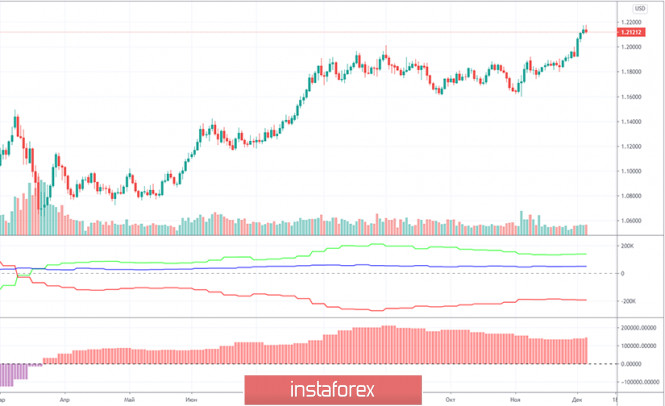
The EUR/USD pair grew by only 80 points during the last reporting week (November 24-30). But the new Commitment of Traders (COT) report indicates that professional traders are becoming more bullish for the second consecutive week. This time, the "non-commercial" group opened 4,300 new Buy-contracts (longs) and closed 300 sell-contracts (shorts). These numbers are not great. Even the general changes in favor of the bulls over the past two weeks cannot be called "breaking the bearish trend". However, the net position of non-commercial traders has been growing for two consecutive weeks. And, apparently, it began to grow synchronously with the resumption of the euro/dollar pair's growth. Unfortunately, COT reports come out three days late. Thus, they can be used to determine the trend, but, as is the case with fundamental analysis, technical confirmation is always required for any conclusions drawn from the COT reports. What do we end up with? The number of open Buy-contracts for professional traders remains high at 212,000, and the number of Sell-contracts is three times less than 67,000. The gap between the two began to narrow around September (the second indicator showing the net position of the non-commercial group), but it is currently growing again. Therefore, we still expect the upward trend to end, because this is what the data of the COT report is implying (especially the first indicator). But we need technical confirmation of this. No macroeconomic reports from the EU last Friday, but there were several quite important ones from America. Let's start with the unemployment rate, which fell from 6.9% to 6.7%. Average hourly wages rose 4.4% y/y. However, the most important indicator was the NonFarm Payrolls. And traders were disappointed with it the most. Although disappointed isn't exactly the right word, since they ignored macroeconomic statistics again. The number of new jobs created outside of agriculture reached 245,000, while the forecast was +469,000. After such a value, the US dollar should have fallen by 100 points down. However, it suddenly increased in the afternoon. Therefore, the dollar did not fall on the very day when it would have been justified, instead, it surprisingly grew. No important reports or events scheduled for the EU and the US on Monday. No global fundamental themes, the development of which could now cause the market to react. At the same time, the euro remains extremely overbought. The US dollar is completely out of demand in 2020 (after March, which is when the pandemic began), although it is absolutely impossible to say that the American economy is now the weakest of all the developed ones. Because if you compare it to the EU, the US causes less concern. We have two trading ideas for December 7: 1) Buyers continue to hold the pair in their hands. Therefore, you are advised to continue trading upward while aiming for the resistance level of 1.2180 when the correction ends. A rebound from the Kijun-sen line (1.2051) can now be used as a signal for new long deals. Take Profit in this case can be up to 100 points. You can also look for possible points for long deals near the lower line of the rising channel. 2) Bears are releasing the pair from their hands more and more every day, nevertheless, the current fundamental background allows them to count on a downward reversal soon. Thus, you are advised to open sell orders while aiming for the Senkou Span B line (1.1901) if the price settles below the Kijun-sen line (1.2051). Take Profit in this case can be up to 120 points. Forecast and trading signals for GBP/USD Explanations for illustrations: Support and Resistance Levels are the levels that serve as targets when buying or selling the pair. You can place Take Profit near these levels. Kijun-sen and Senkou Span B lines are lines of the Ichimoku indicator transferred to the hourly timeframe from the 4-hour one. Support and resistance areas are areas from which the price has repeatedly rebounded off. Yellow lines are trend lines, trend channels and any other technical patterns. Indicator 1 on the COT charts is the size of the net position of each category of traders. Indicator 2 on the COT charts is the size of the net position for the "non-commercial" group. Forecast and trading signals for GBP/USD on December 7. COT report. Analysis of Friday. Recommendations for Monday 2020-12-07 GBP/USD 15M 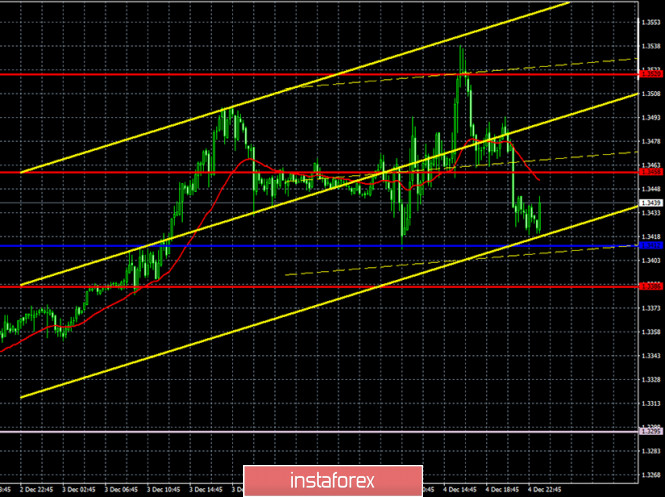 Both linear regression channels are directed to the upside on the 15-minute timeframe, which is fully consistent with what is happening on the hourly timeframe. Despite the regular pullbacks and changes in the direction of movement, the upward trend continues. Therefore, the main thing now is the hourly timeframe, on which the movement is much better seen. GBP/USD 1H 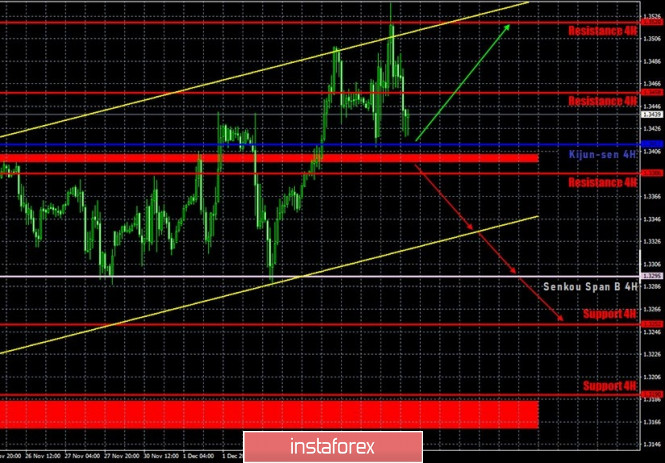 The GBP/USD pair made three breakthroughs in different directions at once last Friday. First down, then up, then down again. Thus, the pair continues to move in a very difficult and inconvenient manner. The pair's quotes dropped to the critical Kijun-sen line last Friday, which can help produce a new buy signal if a rebound follows from it. This is quite possible, given the incessant "swing". And vice versa, if the pair goes below the Kijun-sen and the support area of 1.3396-1.3404, then the probability of sustaining the downward movement will increase. Take note that a new rising channel has appeared, which is quite formal and nominal. We remind you that just recently the pair's quotes were in a 100-point horizontal channel, which is also within this rising channel. Well, the fundamental background is still such that we could only wonder why the pound is growing? COT report 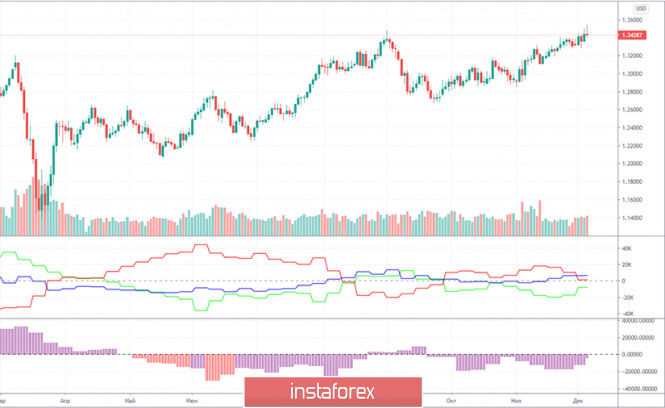
The GBP/USD pair did not grow and did not fall by a single point during the last reporting week (November 24-30). There were no price changes during this period. But in general, there was still an upward trend that extended into the following week. If in the case of the euro/dollar pair, we had been waiting for the beginning of a new downward trend, in the pound/dollar pair's case, the Commitment of Traders (COT) reports did not allow such conclusions to be drawn. You only need to look at both indicators in the chart to understand that there is no trend in the mood of major players. The first indicator constantly shows a shift in the mood of commercial and non-commercial traders from bearish to bullish and vice versa. The second indicator constantly shows that the net position of the "non-commercial" group is growing and decreasing. That is, we can not draw conclusions regarding the pair's future from the COT reports. Non-commercial traders opened 3,600 new Buy-contracts (longs) and closed 4,400 Sell-contracts (shorts) during the reporting week. The net position immediately increased by 8,000, which is a lot for the pound. But there were no price changes. The number of open Buy and Sell contracts for the non-commercial group is practically the same. The fundamental background for the pound came down to the same topic of Brexit trade talks and US reports. Traders of both the euro/dollar and pound/dollar pairs ignored the US reports. The pound is still extremely overbought and unreasonably appreciated. Last week, both London and Brussels promised to complete negotiations by Wednesday, and on Sunday, there was an announcement that David Frost and Michel Barnier decided to hold another round of negotiations in order to try to reach an agreement before the end of the year. 146 talks. No one is talking about the fact that the Parliaments had time to ratify the agreement. Ursula von der Leyen, the head of the European Commission, who is not characterized by empty optimism, recently said that there are still serious differences between the parties on three key issues. It is probably not necessary to say what these issues are. A trade is impossible without solving all three. Thus, we can only wait until both parties declare a complete failure or that negotiations will proceed as long as necessary, without deadlines that are completely inappropriate in such a serious matter. No important reports or events scheduled for the EU and the US on Monday. Therefore, the pair's volatility may slightly decrease, although we can't say it has been high in recent days. The nature of trades will most likely remain unchanged. Thus, we are looking for trading signals using the technique, we are waiting for official information on trade talks. There is nothing else to do. We have two trading ideas for December 7: 1) Buyers for the pound/dollar pair keep the initiative in their hands. If they manage to keep the quotes above the Kijun-sen line (1.3412), then after a rebound from this line, you can open new longs while aiming for the resistance level of 1.3520. Take Profit in this case will be up to 80 points. At the same time, there is a high likelihood of a "swing" that has been present last week. 2) Sellers are still out of work. We recommend selling the pound/dollar pair while aiming for the lower line of the rising channel if the bears manage to get the pair to settle below the Kijun-sen line (1.3412) and the support area of 1.3396-1.3404. Take Profit in this case can be up to 40 points. You can sell the pound once we overcome the rising channel. Forecast and trading signals for EUR/USD Explanations for illustrations: Support and Resistance Levels are the levels that serve as targets when buying or selling the pair. You can place Take Profit near these levels. Kijun-sen and Senkou Span B lines are lines of the Ichimoku indicator transferred to the hourly timeframe from the 4-hour one. Support and resistance areas are areas from which the price has repeatedly rebounded off. Yellow lines are trend lines, trend channels and any other technical patterns. Indicator 1 on the COT charts is the size of the net position of each category of traders. Indicator 2 on the COT charts is the size of the net position for the "non-commercial" group. EUR/USD: Will the US dollar and Euro be involved in a currency conflict? 2020-12-07  Two key factors led the market last week: the possible launch of effective vaccines against COVID-19 and the expectation of further monetary stimulus from central banks. However, the current situation has worsened the correlation of most world currencies. Experts fear that the growing contradictions between the main and emerging markets (EM) currencies will provoke a conflict. Some analysts are afraid of a collision of interests of leading currencies, primarily the dollar and the euro, with the means of payment of other countries. Throughout the previous month, emerging market currencies took the advantage amid investors' growing willingness to acquire risky assets. Experts stated that this has not happened over the past two years. In case that the USD further weakens, EM currencies are expected to continue rising, marking the longest growth in eight years. In view of this, many experts are pessimistic about the US dollar. Statements about its weakening have become an accepted truth, and some opponents agree. On the contrary, few currency strategists believe that the US dollar will strengthen again, recalling that the USD started with a full-scale collapse earlier this month. The situation is currently tense and only the euro, US dollar's rival in the EUR/USD pair, is still winning. However, experts believe that this victory will not last long, since the ECB has lost the so-called battle of the money-printing press. Over the past weeks, the Eurocurrency has clearly risen, despite massive cash infusions from the ECB. It gained an advantage after the Fed cut interest rates to zero and also started the printing press at full capacity. As a result, the balance of the US regulator surged by $ 3.213 trillion, while the European one by € 2.2 trillion. At the upcoming December meeting on December 10-11, the ECB plans to increase cash injections into the European economy to minimize the negative impact of COVID-19. Several analysts assume that Europe may lose the devaluation race, and this could bring down the Eurozone economy by 8.3%. Analysts say that the current situation threatens an imbalance in the EUR/USD pair. Currently, the indicated pair manages to maintain balance, despite the dollar's weakness and euro's growth, which has managed to push the limits of the previous range of 1.1700-1.2000. Based on specialists' observations, there are no significant obstacles foreseen for the euro heading to the level of 1.2500. Today, the EUR/USD pair is trading near the range of 1.2131-1.2132, slightly declining after the weekend. However, experts consider these losses insignificant. 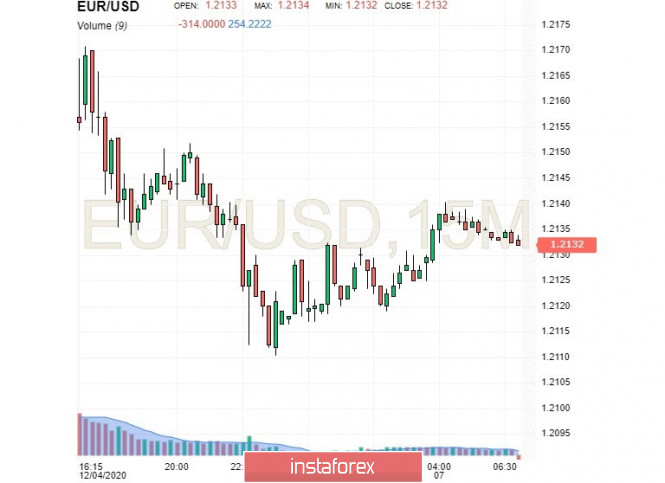 Before the New Year, analysts are concerned that the US dollar will most likely collapse further. This is facilitated by the tense COVID-19 situation in the US and Fed's increase in the money supply by 22%. The market being flooded with dollars led to its depreciation and so, the consequences of this decision will be dealt in 2021. Some analysts, in particular Peter Schiff and Stephen Roach, think that there's still a 50% chance that the US dollar will collapse next year. On the other hand, calculations of other economists are less pessimistic: Citigroup believes that the "New Year" dollar devaluation will not exceed 20%, and Morgan Stanley expects it at 35%. The market is worried about the continuation of the US dollar's downward trend in the new year, but there is still a small hope for a positive reversal. According to experts, a major currency conflict between the EUR and USD, as well as the EM currencies, is not expected in the near future. The leading means of payment do not need to share the global financial space, since they already lead the global market. Still, experts do not rule out point outbreaks next year, but these potential currency wars are not important. Technical Analysis of GBP/USD for December 7, 2020 2020-12-07 Technical Market Outlook: Despite the indication of exhaustion, the GBP/USD pair keeps making a new higher highs as it moves up. Recently Pound has made a new local high at the level of 1.3537, but was capped at the end of the rally and a Bearish Engulfing candlestick pattern was made at the H4 time frame chart. Nevertheless, this situation is only temporary and there is no indication of the up trend termination yet. The nearest technical support is located at 1.3395 and 1.3306. The strong and positive momentum supports the short-term bullish outlook, so only if the demand zone located between the levels of 1.3264 - 1.3295 is clearly violated, then the outlook will change to bearish. Weekly Pivot Points: WR3 - 1.3800 WR2 - 1.3667 WR1 - 1.3552 Weekly Pivot - 1.3410 WS1 - 1.3307 WS2 - 1.3172 WS3 - 1.3057 Trading Recommendations: The GBP/USD pair is in the down trend on the monthly time frame, but the recent bounce from the low at 1.1411 made in the middle of March 2020 looks very strong and might be a reversal swing. In order to confirm the trend change, the bulls have to break through the technical resistance seen at the level of 1.3518. All the local corrections should be used to enter a buy orders as long as the level of 1.2674 is not broken. 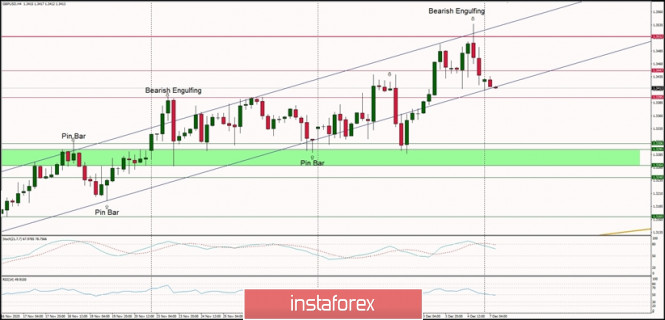
Indicator analysis. Daily review on the EUR/USD currency pair for December 7, 2020 2020-12-07 Trend analysis (Fig. 1). Today, the market may continue to move downward from the level of 1.2121 (closing of Friday's daily candlestick), with the first lower target – a pullback level of 14.6%, 1.2093 (red dotted line). If this line is tested, we can expect the continuation of the upper work with the target of 1.2177 - the resistance level (blue bold line). 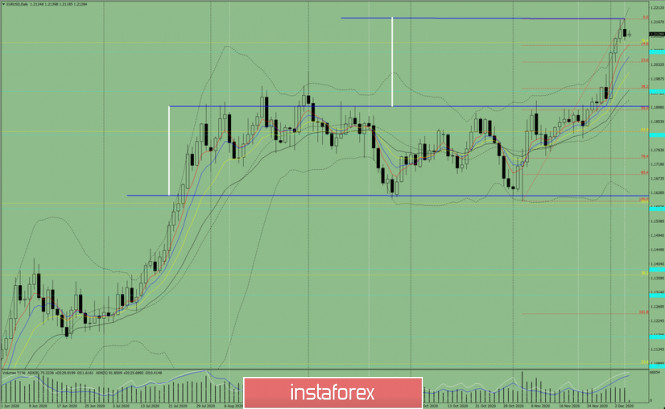
Figure 1 (Daily Chart). Comprehensive analysis: - Indicator analysis - down
- Fibonacci levels - down
- Volumes - down
- Candlestick analysis - down
- Trend analysis - down
- Bollinger bands - down
- Weekly chart - down
General conclusion: Today, the price may continue to move downward with the target of the pullback level of 14.6%, 1.2093 (red dotted line). If this line is tested, we can expect the continuation of the upper work with the target of 1.2177 - the resistance level (blue bold line). Alternative scenario: from the level of 1.2121 (closing of the Friday daily candlestick), the pair may work downward in order to reach the pullback level of 14.6%, 1.2093 (red dotted line). If this line is tested, we can expect the lower work to continue with the target of 1.2072 - the historical support level (blue dotted line). Technical Analysis of EUR/USD for December 7, 2020 2020-12-07 Technical Market Outlook: The EUR/USD pair has broken out from the acceleration channel to hit the level of 1.2163 (high at 1.2174), but since then the pair had been moving sideways. The volatility at the beginning of the trading week is low and the EUR/USD pair trades around the level of 1.2126, still above the upper acceleration channel line. Any violation of this line and move back to the channel will be considered as corrective. Any violation of the lower acceleration channel line will be bearish, so the market participants should keep an eye on the level of 1.2000 again. The nearest technical support is located at the level of 1.2088. Weekly Pivot Points: WR3 - 1.2496 WR2 - 1.2335 WR1 - 1.2244 Weekly Pivot - 1.2088 WS1 - 1.1996 WS2 - 1.1828 WS3 - 1.1738 Trading Recommendations: Since the middle of March 2020 the main trend is on EUR/USD pair has been up. This means any local corrections should be used to buy the dips until the key technical support is broken. The key long-term technical support is seen at the level of 1.1609. The key long-term technical resistance is seen at the level of 1.2555. 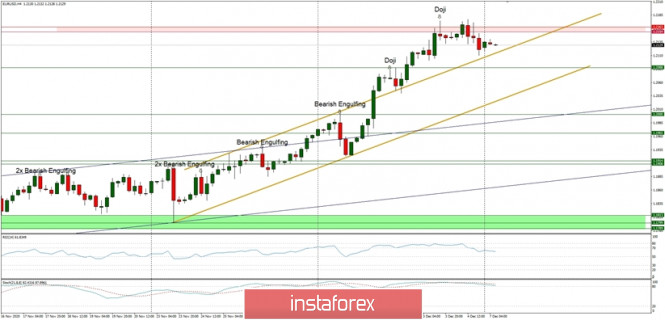
Indicator analysis. Daily review for the GBP/USD currency pair 07/12/2020 2020-12-07 Last Friday, the pair moved up and tested the historical resistance level of 1.3516 (blue dotted line) and then the price went down, testing the pullback level of 14.6% (blue dotted line). Today, the price may continue to move down. News on the market is not expected today. Trend analysis (Fig. 1) Today, the market may continue to move down from the level of 1.3439 (the closing of last Friday's daily candle) with the target of 1.3333 which is a pullback level of 23.6% (blue dotted line). When testing this line, continue to work up with the target of 1.3538 which is the upper fractal (the daily candle from 04/09/2020) blue dotted line. 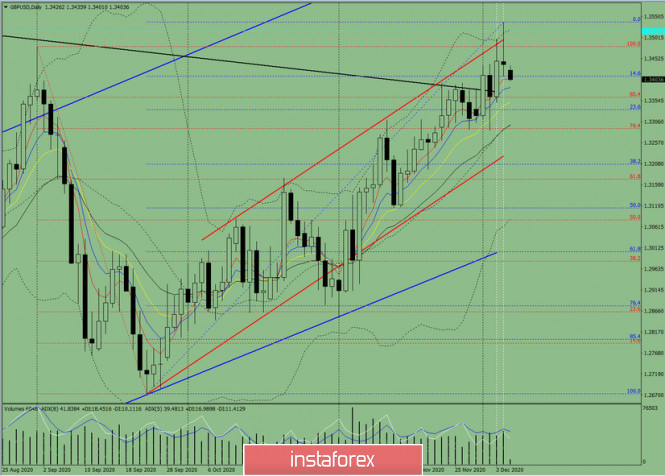 Figure 1 (daily chart) Complex analysis: - Indicator Analysis – down
- Fibonacci Levels – down
- Volumes – down
- Technical Analysis – down
- Trend Analysis – down
- Bollinger Bands – down
- Weekly Chart – down
General conclusion: Today, the price may continue to move down with a target of 1.3333 which is a pullback level of 23.6% (blue dotted line). When testing this line, continue to work up with a target of 1.3538 which is the upper fractal (daily candle from 04/09/2020) blue dotted line. Alternative scenario: From the level of 1.3439 (the closing of last Friday's daily candle), the price may continue to move down with the goal of 1.3333 which is a pullback level of 23.6% (blue dotted line) When testing this line, work down with the target of 1.3208 which is a pullback level of 38.2% (blue dotted line). EUR/USD: plan for the European session on December 7. COT reports. No more people willing to buy euros. Bulls aim to rise above 1.2175 2020-12-07 To open long positions on EUR/USD, you need: It was not possible to wait for a convenient signal to enter the market last Friday. Latest data on the US labor market stumped traders. On the one hand, the number of new jobs in the non-agricultural sector was much less than economists' forecasts, on the other hand, the unemployment rate fell in November, despite the fact that there is an increasing number of coronavirus cases. But before talking about the prospects for the pair's movements, let's look at what happened in the futures market and how the Commitment of Traders (COT) positions changed. Euro buyers continue to dictate their terms. And although there were not as many of them as there could have been, especially given the latest news about the vaccine, it is clear that many market participants are still betting on the euro's appreciation, even at current annual highs. This week we may hear about the expansion of the asset repurchase program and the introduction of negative interest rates from the European Central Bank, which will limit the observed growth potential. However, the likelihood of a later introduction of quarantine measures in the United States forces traders to bypass the US dollar. The COT report for December 1 showed an increase in long positions and a reduction in short positions. Buyers of risky assets believe that the bull market will continue and they also anticipate the euro's growth, after going beyond the psychological mark in the area of the 20th figure. Thus, long non-commercial positions rose from 206,354 to 207,302, while short non-commercial positions fell to 67,407 from 68,104. The total non-commercial net position rose to 139,894 from 138,250 a week earlier. Take note of the delta's growth after its 8-week decline, which indicates a clear advantage of buyers and a possible resumption of the medium-term upward trend for the euro. We can only talk about an even bigger recovery when European leaders have negotiated a new trade deal with Britain. However, we did not receive good news last week, and we have an EU summit ahead of us, which could put the final point in this story. News that restrictive measures will be lifted for the Christmas holidays can provide support to the euro, as well as the absence of major changes in the ECB's monetary policy. Now for the technical picture of the pair. Buyers of the euro need to take control of resistance at 1.2175, only this can lead to another upward wave for the euro and may also help in the bull market. A breakthrough and getting the pair to settle above 1.2175 and testing it from top to bottom produces a good signal to buy the euro in hopes of updating the next high in the 1.2255 area, where I recommend taking profits. We can hardly count on a breakout of 1.2255 since important fundamental statistics on the eurozone economy will not be released today. However, if this happens, I recommend building up long positions to the highs of 1.2339 and 1.2417. In case the euro falls in the first half of the day and buyers' are unable to rise above 1.2175, it is best not to rush into long positions, but to wait until a false breakout forms in the support area of 1.21111. I recommend buying EUR/USD immediately on a rebound but only from the low of 1.2046, counting on a correction of 20-25 points within the day. To open short positions on EUR/USD, you need: Sellers will actively defend resistance at 1.2175, which coincides with annual highs. Forming a false breakout there can result in a new downward wave, which aims to break through the 1.2111 low. Consolidation below this range will open a direct road to the 1.2046 area, where I recommend taking profits. The next target will be the 1.1986 area, testing it will mean a reversal of the current upward trend. If the bulls are strong enough and they manage to rise above the resistance of 1.2175 after receiving the report on the leading indicator of confidence of the eurozone investors, I recommend not to rush to sell. The optimal scenario would be to test the 1.2255 high, where you can sell the euro immediately on a rebound, counting on the pair's downward correction by 15-20 points. Bigger sellers will be located in the resistance area of 1.2339, from where you can also sell the euro immediately on a rebound, counting on a correction of 15-20 points within the day. 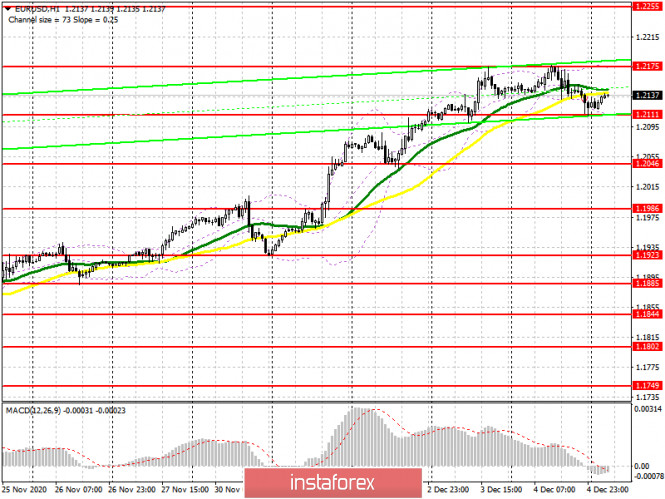
Indicator signals: Moving averages Trading is carried out in the area of 30 and 50 moving averages, which indicates that the pair is hanging in a horizontal channel. Note: The period and prices of moving averages are considered by the author on the H1 hourly chart and differs from the general definition of the classic daily moving averages on the D1 daily chart. Bollinger Bands A breakout of the upper border of the indicator in the 1.2175 area will lead to a new wave of euro growth. A breakout of the lower border of the indicator in the 1.2111 area will increase the pressure on the pair. Description of indicators - Moving average (moving average, determines the current trend by smoothing out volatility and noise). Period 50. It is marked in yellow on the chart.
- Moving average (moving average, determines the current trend by smoothing out volatility and noise). Period 30. It is marked in green on the chart.
- MACD indicator (Moving Average Convergence/Divergence — convergence/divergence of moving averages) Quick EMA period 12. Slow EMA period to 26. SMA period 9
- Bollinger Bands (Bollinger Bands). Period 20
- Non-commercial speculative traders, such as individual traders, hedge funds, and large institutions that use the futures market for speculative purposes and meet certain requirements.
- Long non-commercial positions represent the total long open position of non-commercial traders.
- Short non-commercial positions represent the total short open position of non-commercial traders.
- Total non-commercial net position is the difference between short and long positions of non-commercial traders.
GBP/USD: plan for the European session on December 7. COT reports. Traders left without news on Brexit. France reiterated that it can block the deal 2020-12-07 To open long positions on GBP/USD, you need: Expectations that a trade agreement is about to be reached has provided support to the pound last Friday, but French President Macron said that they will block the deal if it didn't suit them, which caused the pound to fall and resulted in a larger profit taking on long positions by the end of last week. Before examining the pound's technical picture and running to buy it, let's take a look at what happened in the futures market last week. Lack of clarity on the trade deal, along with the lockdown of the British economy, which was extended until mid-December, does not add optimism and confidence to buyers of the pound. However, expectation that the leaders will still be able to make concessions and find the necessary common ground on the key issue of fisheries leaves hope for the pound's successive growth. But time is running out, since they should have come to an agreement yesterday. The Commitment of Traders (COT) reports for November 24 indicates significant interest in the pound, as many traders hoped that the Brexit deal would be finalized. Long non-commercial positions rose from 30,838 to 37,087. At the same time, short non-commercial positions decreased from 47,968 to 44,986. As a result, the negative non-commercial net position was -7,899 against -17,130 a week earlier. This indicates that sellers of the British pound retain control and it also shows their slight advantage in the current situation, but the market is beginning to gradually come back to risks, and reaching a trade deal will help it in this. As for the technical picture of the pair, pound buyers should break through and get the pair to settle above the resistance of 1.3436, which they managed to miss in today's Asian session. Testing this range from top to bottom produces a fairly good signal to open long positions in anticipation of bringing back the bull market, which will lead to a test of the 1.3483 area, where I recommend taking part of the profit. The next task will be to update the high at 1.3534, where I advise you to leave long deals. If the pressure on the pound increases, and I expect that this will be the case at the beginning of that week, then forming a false breakout in the support area of 1.3393 will be a signal to open long positions. Otherwise, it is best to postpone long deals until a new low of 1.3350 has been tested, or open long positions immediately on a rebound from a strong support of 1.3290, which will be broken only if there is no agreement on Brexit this week. To open short positions on GBP/USD, you need: The initial task of the pound sellers is to return support at 1.3393 under their control. Getting the pair to settle below this range and testing it from the bottom up produces a good entry point into short positions, which will open a direct road to the 1.3350 low. Receiving negative news on the trade deal will surely pull down GBP/USD to the support area of 1.3290, which saved the pound from a major fall last week. The pound's succeeding direction depends if we break through this level, since there are a number of buyers' stop orders below, removing it will quickly pull down the pound to lows of 1.3194 and 1.3114, where I recommend taking profits. The longer the uncertainty about the trade agreement with the EU persists, the more it will weigh on the pound. If the bulls continue to push the pound up, it is best not to rush to sell, but wait until a false breakout forms in the resistance area of 1.3436 and open short positions only after that. I recommend selling GBP/USD immediately on a rebound from the high of 1.3483 or even higher from the resistance of 1.3534, counting on a downward correction of 20-30 points within the day. 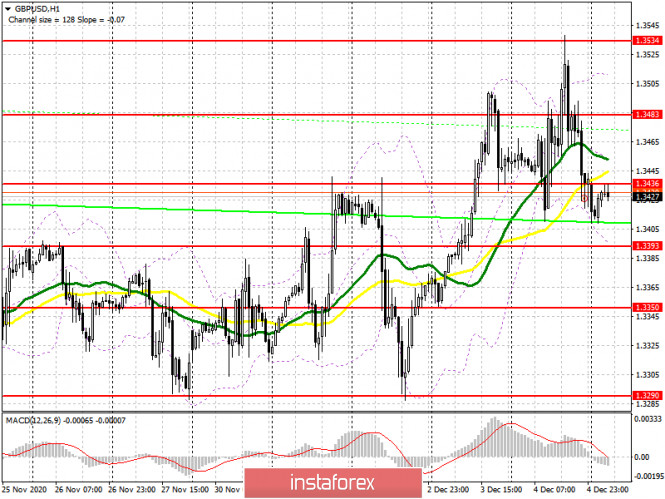
Indicator signals: Moving averages Trading is carried out in the area of 30 and 50 moving averages, which indicates the sideways nature of the market. Note: The period and prices of moving averages are considered by the author on the H1 hourly chart and differs from the general definition of the classic daily moving averages on the D1 daily chart. Bollinger Bands If the pair grows, the upper border of the indicator in the 1.3520 area will act as a resistance. A breakout of the lower border of the indicator in the 1.3393 area will increase the pressure on the pair. Description of indicators - Moving average (moving average, determines the current trend by smoothing out volatility and noise). Period 50. It is marked in yellow on the chart.
- Moving average (moving average, determines the current trend by smoothing out volatility and noise). Period 30. It is marked in green on the chart.
- MACD indicator (Moving Average Convergence/Divergence — convergence/divergence of moving averages) Quick EMA period 12. Slow EMA period to 26. SMA period 9
- Bollinger Bands (Bollinger Bands). Period 20
- Non-commercial speculative traders, such as individual traders, hedge funds, and large institutions that use the futures market for speculative purposes and meet certain requirements.
- Long non-commercial positions represent the total long open position of non-commercial traders.
- Short non-commercial positions represent the total short open position of non-commercial traders.
- Total non-commercial net position is the difference between short and long positions of non-commercial traders.
EUR/USD. US dollar's late reaction to disappointing data 2020-12-07 The US dollar reacted late to the release of US labor market growth data. Last Friday, the indicated currency actually ignored Nonfarm and strengthened its position amid massive profit taking. As this week started, the dollar returned to its usual weakening. During the Asian session, the major dollar pairs did not continue Friday's trend towards the dollar's strengthening. And although we are talking about minimal price fluctuations of a flat nature, we can conclude that the US dollar is still a vulnerable currency, and the market has not yet recovered the NonFarms in November. In general, Friday's data release was weaker than expected, reflecting a stronger slowdown in the US labor market. The report was controversial, with its own strengths and weaknesses. On one hand, the unemployment rate declined, while salary indicators increased. On the other hand, there are other data that are below than the predicted values. In this regard, the number of people employed in the non-agricultural sector rose by 245 thousand, but experts expected to see this indicator much higher – almost at the level of half a million (480 thousand). The growth in the number of people employed in the manufacturing sector was also disappointing. It rose by only 27 thousand, instead of the forecasted growth of 53 thousand. There is also a similar situation in the private sector of the economy, where experts expected to see an increase of almost 600 thousand jobs, but in reality, the indicator grew by only 344 thousand. 
Nevertheless, Friday's release also had a positive side. For example, salaries turned out to be slightly better than predicted values. Traders saw that the average hourly wages on a monthly basis rose by 0.4%, although it is expected to decline to zero. In annual terms, the index remained at the October level (4.4%). The unemployment rate, which dropped to 6.7%, was also pleasant. However, it is necessary to consider that the unemployment rate does not react so quickly to the current situation, as it is one of the lagging economic indicators. Therefore, some traders' optimism about reducing unemployment is still early, since more operational indicators are not so optimistic – all components came out below the forecast values. In particular, the growth employment rate in the non-agricultural sector has been declining for five consecutive months. The number of initial applications for unemployment benefits does not fall below 700 thousand, although this indicator showed a steady decline at the beginning of autumn. All this suggests that the autumn surge amid COVID-19 situation in the US has not yet fully manifested itself, although the weak growth in the number of employees should serve as a warning for both the Fed members and USD bulls. Last Friday, some Fed officials have already commented on the release. Thus, the Fed's President of Chicago, Charles Evans, said that he was slightly disappointed with the key report on the labor market. In his opinion, the US economic recovery is uneven, as the situation in different sectors is dissimilar. He also emphasized that he does not expect rates to grow earlier than 2023 or even 2024. At the same time, a more pessimistic position was voiced out by the Fed's President of Minneapolis, Neel Kashkari (who is a representative of the "dovish" camp). According to him, the real unemployment rate is about 10%, while the full recovery of the economy is still far away. Thus, he expects that the situation may not improve until the second half of next year. It is noteworthy that all the FRS representatives who spoke last week (with both "dovish" and "hawkish" rhetoric) pointed to the necessity of passing a law on the allocation of additional assistance to the US economy. In particular, Evans said that the most important type of stimulation for the country's economy in the coming months will be fiscal stimulation as he assessed the medium-term prospects. In fact, this issue will soon be among the priorities for dollar bulls in general, and for EUR/USD traders in particular, although this week will be filled with other events. For example, ECB's last meeting results this year and key indicators of US inflation will be known on Thursday. Moreover, Brexit will also influence the Euro, which negotiation process is reaching and end. Also this week, the US Food and Drug Administration is due to make its decision on the coronavirus vaccine, particularly the two drugs produced by Pfizer and BioNTech, as well as by the pharmaceutical company Moderna. As stated by Mr. Trump yesterday, vaccination against COVID should start by mid-December in the US. This fact may increase interest in risky assets, while the safe dollar will be out of business again. 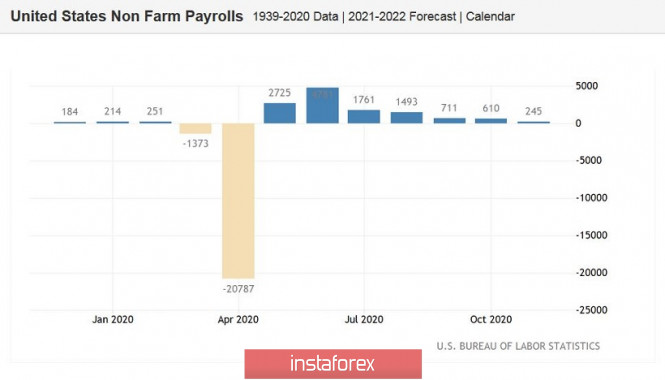
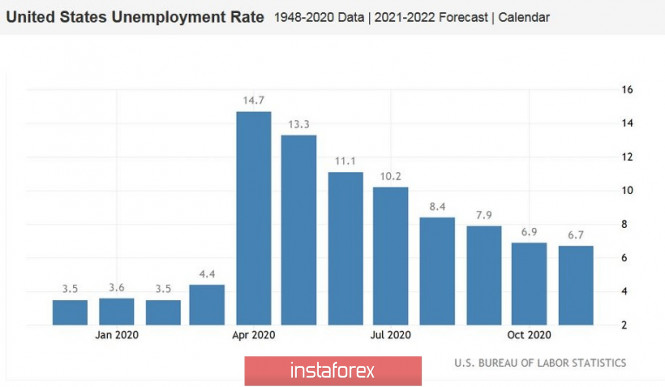
In general, the priority for the EUR/USD pair will be long positions in the next two days (until Wednesday) – traders will use corrective recessions as an excuse to open long positions. However, it is better to leave buy deals before the ECB's December meeting. The EUR/USD pair is now at multi-month highs, and this fact is likely to be the subject of criticism from the ECB representatives. In addition, the anticipation of new measures to ease monetary policy may lead to massive profit taking. From a technical viewpoint, the price will continue to rise, with a retest of the level of 1.2177 (this year's high, which was reached last week). The pair continues to trade in an upward trend, being in the extended channel of the Bollinger Bands indicator, while the price is located between the upper and middle lines of the indicator, which act as support (1.1930) and resistance (1.2177) levels. GBP/USD and EUR/USD: Brexit negotiations will continue today, and many expect the UK and the EU to finally reach a compromise. Meanwhile, the ECB may make significant changes to its monetary policy. 2020-12-07 Negotiations on a post-Brexit trade deal will continue today, and many expect that the UK and the EU will finally reach a compromise to one of the main issues - access to UK fishing waters. However, the chance of concluding a deal is 50-50.  In any case, both parties need to be able to ratify an agreement, because on December 31, the United Kingdom will leave the EU market and customs union. Last week, rumors arose that a treaty will be struck as the EU is likely to give in to some terms in exchange for the UK joining rules prescribing stricter business regulation. However, these rumors remained only rumors, and fortunately did not affect trading during the Asian session in any way. It was only when France reiterated that it could veto the trade deal if they didn't like the terms that demand for the British pound declined. Many European leaders believe that it is unacceptable to make concessions to reach an agreement, even if pressure was exerted on the EU negotiating group. Moreover, last week, EU chief negotiator, Michel Barnier, rejected a request from EU officials to see key parts of the agreement before it was drafted. Many expressed outrage over this issue, saying that this was done on purpose, leaving too little time for a thorough study of all the nuances of the agreement. As a result, pressure continued to increase in the pound, so many traders decided to wait out the situation. The current technical picture of the GBP / USD pair indicates that a breakout in the resistance level of 1.3490 will lead to a strong bullish movement towards 1.3600 and 1.3690, while a breakout in the support level of 1.3290 will push the quote to 1.3190 and 1.3110. EUR / USD According to Capital Economics, funds from the EU recovery fund will begin to be distributed in the first half of 2021. However, the differences with Poland and Hungary have not been resolved, and these countries have recently announced that they can block this decision if a compromise is not found. Nonetheless, most likely, the differences within the multi-year draft of the EU budget will be resolved, since Poland and Hungary are simply bargaining for better terms. But until the budget is agreed upon and the new fund goes live, the European Central Bank will have to ensure fiscal sustainability, which suggests that most likely, the European regulator will make changes in its monetary policy. Therefore, at its meeting this week, the European Central Bank may increase their program by € 500 billion. The next expansion may occur as early as mid-2021, when the consequences of the coronavirus pandemic will become clear, and the problems with it will be solved with the help of the vaccine. It is expected that another € 250 billion will be allocated through PEPP, and all programs will continue to operate until 2022. Thus, the chances of seeing an increase in interest rates will only appear in 2023, since by that time, inflation might have recovered ... It is expected that under the new program, by the end of 2021, the Central Bank will buy bonds for an average of € 100 billion per month. With regards to economic reports, the latest data on US nonfarm employment was published, and its figures signal the need for additional stimulus. According to the report, the growth in the indicator has slowed very sharply, and it is expected that it will drop further this December. Full consensus on the $ 900 billion economic support program has yet to be reached between Republicans and Democrats, but there is movement in this direction. 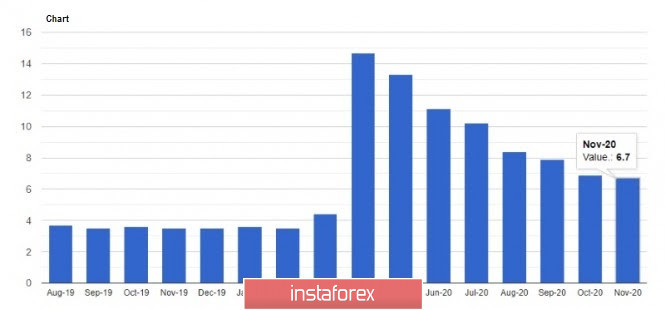 The data indicated that jobs have grown by only 245,000 this November, while experts expected a growth of about 440,000. The unemployment rate itself fell from 6.9% to 6.7%, but this happened only due to the fact that the number of job seekers fell, which suggests that the recent increase of COVID-19 infections have negatively affected the desire of households to look for jobs ... But according to Minneapolis Fed President, Neel Kashkari, the drop in US unemployment rate this November is deceptive, since the real unemployment rate is about 10%. Kashkari believes the United States will have a very long way to go before the economy fully recovers, and the road will be very intermittent until the vaccine is widely distributed. Moreover, he does not expect a sharp rise in inflation in the near future, but would be happy with a moderate growth. 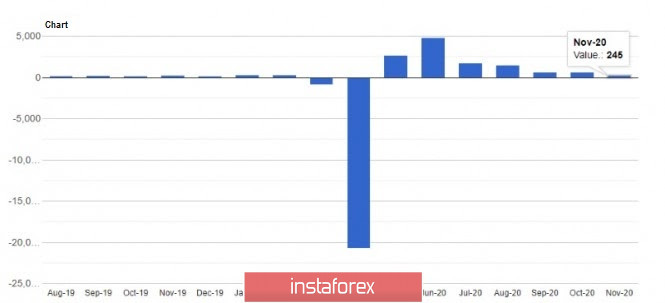 As for manufacturing orders in the United States, the figure rose 1% in October, up from its record in the previous month. The report also noted that jobs have increased at a significant pace this November, indicating continued signs of robust growth, as evidenced by the activity reports last week. All these suggest that growth in the euro will be doubtful this week, especially since the European Central Bank may make significant changes in its monetary policy. A breakout in the resistance level of 1.2175 will bring the pair towards 1.2260 and 12340, but if the quote drops below 1.2110, the euro will collapse to 1.2040 and 1.1980. Forex forecast 12/07/2020 on EUR/USD, USD/CAD and GBP/USD from Sebastian Seliga 2020-12-07 Let's take a look at the EUR/USD, USD/CAD and GBP/USD technical analysis on the daily time frame chart.
Author's today's articles: Stanislav Polyanskiy  Graduated from Odessa State Economic University. On Forex since 2006. Writes analytical reviews about international financial markets for more than 3 years. Worked as a currency analyst in different finance companies for a long time including the biggest companies of Russia and Ukraine. Graduated from Odessa State Economic University. On Forex since 2006. Writes analytical reviews about international financial markets for more than 3 years. Worked as a currency analyst in different finance companies for a long time including the biggest companies of Russia and Ukraine. l Kolesnikova  text text Sebastian Seliga  Sebastian Seliga was born on 13th Oсtober 1978 in Poland. He graduated in 2005 with MA in Social Psychology. He has worked for leading financial companies in Poland where he actively traded on NYSE, AMEX and NASDAQ exchanges. Sebastian started Forex trading in 2009 and mastered Elliott Wave Principle approach to the markets by developing and implementing his own trading strategies of Forex analysis. Since 2012, he has been writing analitical reviews based on EWP for blogs and for Forex websites and forums. He has developed several on-line projects devoted to Forex trading and investments. He is interested in slow cooking, stand-up comedy, guitar playing, reading and swimming. "Every battle is won before it is ever fought", Sun Tzu Sebastian Seliga was born on 13th Oсtober 1978 in Poland. He graduated in 2005 with MA in Social Psychology. He has worked for leading financial companies in Poland where he actively traded on NYSE, AMEX and NASDAQ exchanges. Sebastian started Forex trading in 2009 and mastered Elliott Wave Principle approach to the markets by developing and implementing his own trading strategies of Forex analysis. Since 2012, he has been writing analitical reviews based on EWP for blogs and for Forex websites and forums. He has developed several on-line projects devoted to Forex trading and investments. He is interested in slow cooking, stand-up comedy, guitar playing, reading and swimming. "Every battle is won before it is ever fought", Sun Tzu Sergey Belyaev  Born December 1, 1955. In 1993 graduated from Air Force Engineering Academy. In September 1999 started to study Forex markets. Since 2002 has been reading lectures on the technical analysis . Is fond of research work. Created a personal trading system based on the indicator analysis. Authored the book on technical analysis "Calculation of the next candlestick". At present the next book is being prepared for publishing "Indicator Analysis of Forex Market. Trading System Encyclopedia". Has created eleven courses on indicator analysis. Uses classical indicators. Works as a public lecturer. Held numerous seminars and workshops presented at international exhibitions of financial markets industry. Is known as one of the best specialists in the Russian Federation researching indicator analysis. Born December 1, 1955. In 1993 graduated from Air Force Engineering Academy. In September 1999 started to study Forex markets. Since 2002 has been reading lectures on the technical analysis . Is fond of research work. Created a personal trading system based on the indicator analysis. Authored the book on technical analysis "Calculation of the next candlestick". At present the next book is being prepared for publishing "Indicator Analysis of Forex Market. Trading System Encyclopedia". Has created eleven courses on indicator analysis. Uses classical indicators. Works as a public lecturer. Held numerous seminars and workshops presented at international exhibitions of financial markets industry. Is known as one of the best specialists in the Russian Federation researching indicator analysis. Maxim Magdalinin  In 2005 graduated from the Academy of the Ministry of Internal Affairs of the Republic of Belarus, law faculty. Worked as a lawyer for three years in one of the biggest country's company. Besides the trading, he develops trading systems, writes articles and analytical reviews. Works at stock and commodity markets explorations. On Forex since 2006. In 2005 graduated from the Academy of the Ministry of Internal Affairs of the Republic of Belarus, law faculty. Worked as a lawyer for three years in one of the biggest country's company. Besides the trading, he develops trading systems, writes articles and analytical reviews. Works at stock and commodity markets explorations. On Forex since 2006. Irina Manzenko  Irina Manzenko Irina Manzenko Pavel Vlasov  No data No data
Subscription's options management Theme's:
Fundamental analysis, Fractal analysis, Wave analysis, Technical analysis, Stock Markets
Author's :
A Zotova, Aleksey Almazov, Alexander Dneprovskiy, Alexandr Davidov, Alexandros Yfantis, Andrey Shevchenko, Arief Makmur, Dean Leo, Evgeny Klimov, Fedor Pavlov, Grigory Sokolov, I Belozerov, Igor Kovalyov, Irina Manzenko, Ivan Aleksandrov, l Kolesnikova, Maxim Magdalinin, Mihail Makarov, Mohamed Samy, Mourad El Keddani, Oleg Khmelevskiy, Oscar Ton, Pavel Vlasov, Petar Jacimovic, R Agafonov, S Doronina, Sebastian Seliga, Sergey Belyaev, Sergey Mityukov, Stanislav Polyanskiy, T Strelkova, Torben Melsted, V Isakov, Viktor Vasilevsky, Vladislav Tukhmenev, Vyacheslav Ognev, Yuriy Zaycev, Zhizhko Nadezhda
Edit data of subscription settings
Unsubscribe from the mailing list Sincerely,
Analysts Service | If you have any questions, you can make a phone call using one of the
InstaForex Toll free numbers right now:
|  |  InstaForex Group is an international brand providing online trading services to the clients all over the world. InstaForex Group members include regulated companies in Europe, Russia and British Virgin Islands. This letter may contain personal information for access to your InstaForex trading account, so for the purpose of safety it is recommended to delete this data from the history. If you have received this letter by mistake, please contact InstaForex Customer Relations Department. |


 Graduated from Odessa State Economic University. On Forex since 2006. Writes analytical reviews about international financial markets for more than 3 years. Worked as a currency analyst in different finance companies for a long time including the biggest companies of Russia and Ukraine.
  text
text  Sebastian Seliga was born on 13th Oсtober 1978 in Poland. He graduated in 2005 with MA in Social Psychology. He has worked for leading financial companies in Poland where he actively traded on NYSE, AMEX and NASDAQ exchanges. Sebastian started Forex trading in 2009 and mastered Elliott Wave Principle approach to the markets by developing and implementing his own trading strategies of Forex analysis. Since 2012, he has been writing analitical reviews based on EWP for blogs and for Forex websites and forums. He has developed several on-line projects devoted to Forex trading and investments. He is interested in slow cooking, stand-up comedy, guitar playing, reading and swimming. "Every battle is won before it is ever fought", Sun Tzu
  Born December 1, 1955. In 1993 graduated from Air Force Engineering Academy. In September 1999 started to study Forex markets. Since 2002 has been reading lectures on the technical analysis . Is fond of research work. Created a personal trading system based on the indicator analysis. Authored the book on technical analysis "Calculation of the next candlestick". At present the next book is being prepared for publishing "Indicator Analysis of Forex Market. Trading System Encyclopedia". Has created eleven courses on indicator analysis. Uses classical indicators. Works as a public lecturer. Held numerous seminars and workshops presented at international exhibitions of financial markets industry. Is known as one of the best specialists in the Russian Federation researching indicator analysis.
  In 2005 graduated from the Academy of the Ministry of Internal Affairs of the Republic of Belarus, law faculty. Worked as a lawyer for three years in one of the biggest country's company. Besides the trading, he develops trading systems, writes articles and analytical reviews. Works at stock and commodity markets explorations. On Forex since 2006.
  Irina Manzenko
  No data
No comments:
Post a Comment