| EUR/USD: plan for the European session on December 11. COT reports. ECB plans do not restrain euro from rising against dollar 2020-12-11 To open long positions on EUR/USD, you need: In yesterday's afternoon forecast, I mentioned buying from the 1.2099 level, which is what happened. Let's take a look at the 5-minute chart and talk about where you can and should enter the market. The demand for the euro returned following the European Central Bank meeting, as Lagarde did not say anything terrible that could somehow influence the upward trend. Therefore, a breakout and being able to settle above 1.2099, along with testing this level from top to bottom, produced an excellent signal to buy the euro, which quickly materialized at the high of 1.2145. The upward movement was 45 points. I did not wait for sales on a false breakout from 1.2145, since it wasn't updated from the bottom up, after failing to consolidate. I marked all areas on the chart. 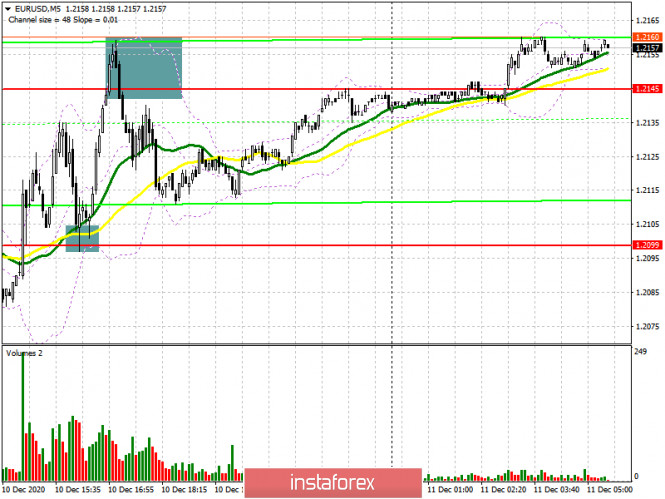
At the moment, I decided to abandon the resistance in the area of the weekly high and moved it to the 1.2202 level, to which the euro is now striving. The main task of the bulls in the first half of the day is to protect support at 1.2145. Forming a false breakout there will be a new signal to open long positions in order to update the high of 1.2202. A breakout and being able to settle at this range will quickly lead the euro to a new target of 1.2255, where I recommend taking profits. In case EUR/USD returns to the area below the support level of 1.2145 in the first half of the day, and weak data on Germany and Italy may contribute to this, then I recommend postponing long positions until the low of 1.2099 has been updated, where the moving averages play on the side of buyers. Or buy EUR/USD immediately on a rebound from the low of 1.2046, counting on an upward correction of 20-30 points within the day. To open short positions on EUR/USD, you need: Pound sellers are currently focused on returning the pair to 1.2145, which they missed during the Asian session today. The ECB's recent statement did not bring bearish sentiment back to the market, so today it is necessary to be very careful. Falling below 1.2145 and testing this area from the bottom up produces a good signal to open short positions in hopes to fall to a low of 1.2099. We can only talk about a reversal of the upward trend, which appeared yesterday, after breaking through 1.2099, which will quickly pull down EUR/USD to a low of 1.2046, where I recommend taking profit. In case the euro grows further, I advise returning to short positions only after the resistance test of 1.2202. If bears are not active there, it is best to wait for sales from a new high of 1.2255, from which a larger downward correction by 15-20 points within the day may occur. 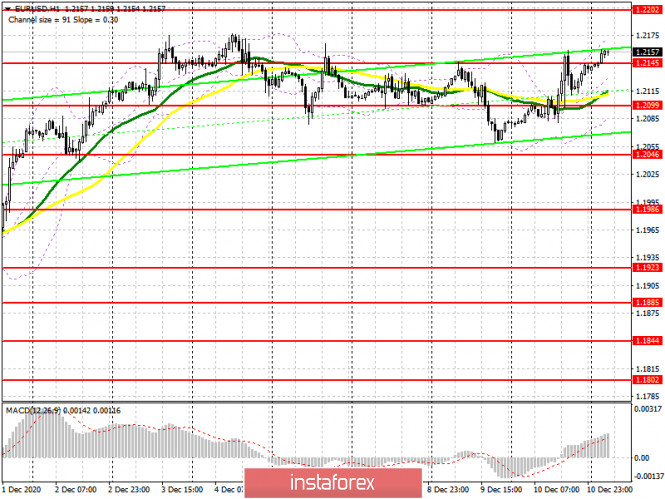
The Commitment of Traders (COT) report for December 1 showed an increase in long positions and a reduction in short positions. Buyers of risky assets believe that the bull market will continue and they also anticipate the euro's growth, after going beyond the psychological mark in the area of the 20th figure. Thus, long non-commercial positions rose from 206,354 to 207,302, while short non-commercial positions fell to 67,407 from 68,104. The total non-commercial net position rose to 139,894 from 138,250 a week earlier. Take note of the delta's growth after its 8-week decline, which indicates a clear advantage of buyers and a possible resumption of the medium-term upward trend for the euro. We can only talk about an even bigger recovery when European leaders have negotiated a new trade deal with Britain. However, we did not receive good news last week, and we have an EU summit ahead of us, which could put the final point in this story. News that restrictive measures will be lifted for the Christmas holidays can provide support to the euro, as well as the absence of major changes in the ECB's monetary policy. Indicator signals: Moving averages Trading is conducted above 30 and 50 moving averages, which indicates the advantage of buyers over sellers. Note: The period and prices of moving averages are considered by the author on the H1 hourly chart and differs from the general definition of the classic daily moving averages on the D1 daily chart. Bollinger Bands In case of a breakout of the upper border of the indicator in the 1.2155 area, we can expect an increase in demand for the euro. In case the pair falls, support will be provided by the lower border of the indicator in the 1.2080 area. Description of indicators - Moving average (moving average, determines the current trend by smoothing out volatility and noise). Period 50. It is marked in yellow on the chart.
- Moving average (moving average, determines the current trend by smoothing out volatility and noise). Period 30. It is marked in green on the chart.
- MACD indicator (Moving Average Convergence/Divergence — convergence/divergence of moving averages) Quick EMA period 12. Slow EMA period to 26. SMA period 9
- Bollinger Bands (Bollinger Bands). Period 20
- Non-commercial speculative traders, such as individual traders, hedge funds, and large institutions that use the futures market for speculative purposes and meet certain requirements.
- Long non-commercial positions represent the total long open position of non-commercial traders.
- Short non-commercial positions represent the total short open position of non-commercial traders.
- Total non-commercial net position is the difference between short and long positions of non-commercial traders.
GBP/USD: plan for the European session on December 11. COT reports. Pound buyers are less confident in the Brexit trade deal. We are waiting for the breakdown of 1.3246 2020-12-11 To open long positions on GBP/USD, you need: After a fairly large number of deals in the morning, which I analyzed in detail in my afternoon review, we did not obtain anything that was comprehensible during the US session. A signal to buy the pound from the 1.3246 level worked out, afterwards the market hovered around the 1.3290 level, which has retained its importance at the moment. 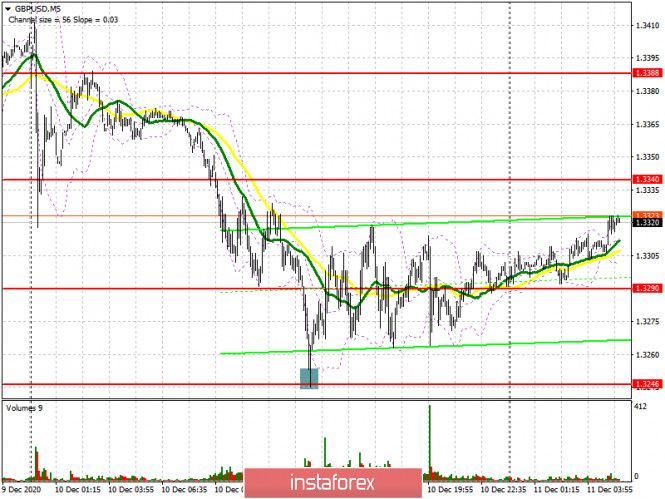
The buyers' task is to maintain control over the 1.3290 level. Forming a false breakout there in the first half of the day will be an excellent signal to open long positions in hopes for the pound to recover in the short term. The main goal will be a breakout and getting the pair to settle above the resistance of 1.3340, testing it from top to bottom, produces an additional entry point into long positions in hopes to reach a high of 1.3388, where I recommend taking profits. The next targets are resistances at 1.3437 and 1.3489, but they will only be available if we receive good news on the Brexit deal. In case bulls are not active in the 1.3290 support area, it is best not to rush into long deals, but to wait until the 1.3246 low has been updated. Take note that this will be the third test of this area, which may once again be unable to withstand bearish pressure. Therefore, I also recommend opening long positions from there only after forming a false breakout. A larger support level is seen in the 1.3198 area, where you can buy GBP/USD immediately on a rebound, counting on a correction of 20-30 points. To open short positions on GBP/USD, you need: The summary and minutes of the meeting of the Committee on Financial Policy B will be released today, and Bank of England Governor Andrew Bailey will also deliver a speech. Most likely, he will repeat the statements calling for a trade deal, since it will be much more difficult for the central bank to support the economy without it, as even more stimulating measures will be required. A negative tone and hints of negative interest rates will put pressure on the pound. Forming a false breakout in the resistance area of 1.3340, where the moving averages pass, playing on the side of sellers, will return pressure to the pair and lead to a test of support at 1.3290. Its breakout and consolidation below, and testing it from the bottom up, produces a good signal to sell the pound in hopes for it to fall to the 1.3246 low, on which the bear market will depend. Bad news on the trade deal can sharply pull down GBP/USD around 1.3198 and 1.3114 lows. If the bulls manage to beat off the 1.3340 level, then it is better not to rush with short positions. The optimal scenario for selling the pound would be failure to settle above 1.3388. I recommend opening short positions immediately on a rebound from the high of 1.3437, counting on a downward correction of 25-30 points within the day. Let me remind you that the parties agreed to continue negotiations and the next deadline is set for December 13 of this year. 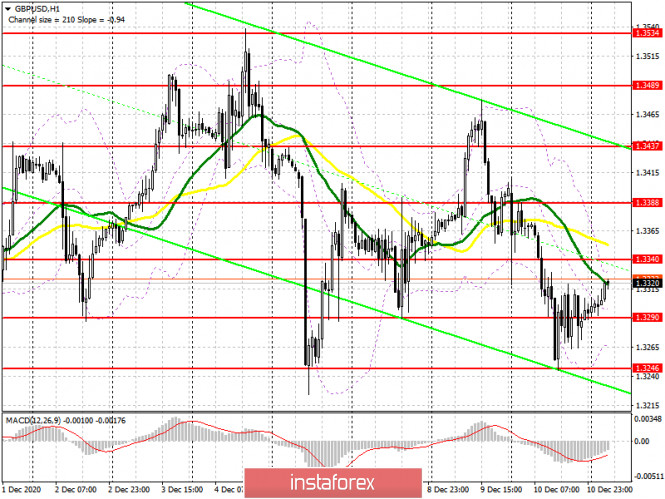
The Commitment of Traders (COT) reports for November 24 indicates significant interest in the pound, as many traders hoped that the Brexit deal would be finalized. Long non-commercial positions rose from 30,838 to 37,087. At the same time, short non-commercial positions decreased from 47,968 to 44,986. As a result, the negative non-commercial net position was -7,899 against -17,130 a week earlier. This indicates that sellers of the British pound retain control and it also shows their slight advantage in the current situation, but the market is beginning to gradually come back to risks, and reaching a trade deal will help it in this. Indicator signals: Moving averages Trading is carried out below 30 and 50 moving averages, which indicates an attempt by the bears to renew the pressure on the pound. Note: The period and prices of moving averages are considered by the author on the H1 hourly chart and differs from the general definition of the classic daily moving averages on the D1 daily chart. Bollinger Bands A break of the lower border of the indicator around 1.3265 will increase the pressure on the pound. A breakout of the upper border of the indicator in the 1.3325 area will lead to a new wave of growth in the pair. Description of indicators - Moving average (moving average, determines the current trend by smoothing out volatility and noise). Period 50. It is marked in yellow on the chart.
- Moving average (moving average, determines the current trend by smoothing out volatility and noise). Period 30. It is marked in green on the chart.
- MACD indicator (Moving Average Convergence/Divergence — convergence/divergence of moving averages) Quick EMA period 12. Slow EMA period to 26. SMA period 9
- Bollinger Bands (Bollinger Bands). Period 20
- Non-commercial speculative traders, such as individual traders, hedge funds, and large institutions that use the futures market for speculative purposes and meet certain requirements.
- Long non-commercial positions represent the total long open position of non-commercial traders.
- Short non-commercial positions represent the total short open position of non-commercial traders.
- Total non-commercial net position is the difference between short and long positions of non-commercial traders.
Indicator analysis. Daily review for the EUR/USD currency pair 11/12/2020 2020-12-11 Trend analysis (Fig. 1). Today, from the level of 1.2137 (the closing of yesterday's daily candle), the market will try to continue moving up with the target of the resistance level at 1.2174 (blue bold line). If this level is tested, it is possible to continue working up to the target of 1.2274 which is a pullback level of 85.4% (yellow dotted line). 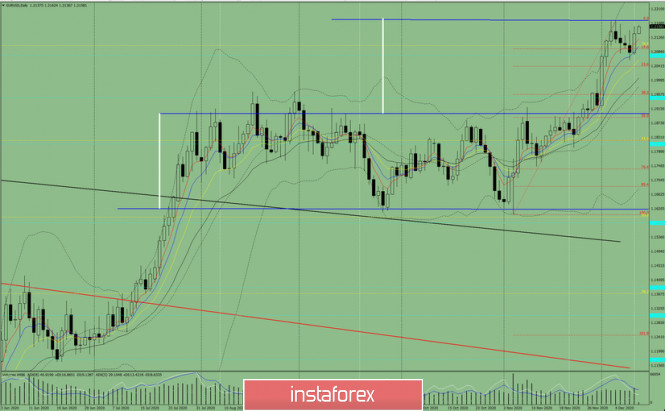 Figure 1 (daily chart). Complex analysis: - Indicator Analysis – up
- Fibonacci Levels – up
- Volumes – up
- Technical Analysis – down
- Trend Analysis – up
- Bollinger Bands – up
- Weekly Chart – up
General conclusion: Today, from the level of 1.2137 (the closing of yesterday's daily candle), the price will try to continue moving up with the target of 1.2174 which is the resistance level (blue bold line). If this level is tested, it is possible to continue working up to the target of 1.2274 which is a pullback level of 85.4% (yellow dotted line). Alternative scenario: After moving up and testing the resistance level at 1.2174 (blue bold line), work down with the goal of 1.2093 which is a pullback level of 14.6% (red dotted line). Technical Analysis of EUR/USD for December 11, 2020 2020-12-11 Technical Market Outlook: The EUR/USD pair has bounced from the acceleration channel lower line around the level of 1.2071. The local low was made at the level of 1.2059, just below the intraday technical support seen at 1.2088 and since then the market moved higher towards the swing high seen at 1.2117. Any further violation of the local low at 1.2059 will be bearish, so the market participants should keep an eye on the level of 1.2000 again. Please notice, the momentum is now hovering around the neutral level of fifty and the market is coming of the overbought conditions. Weekly Pivot Points: WR3 - 1.2496 WR2 - 1.2335 WR1 - 1.2244 Weekly Pivot - 1.2088 WS1 - 1.1996 WS2 - 1.1828 WS3 - 1.1738 Trading Recommendations: Since the middle of March 2020 the main trend is on EUR/USD pair has been up. This means any local corrections should be used to buy the dips until the key technical support is broken. The key long-term technical support is seen at the level of 1.1609. The key long-term technical resistance is seen at the level of 1.2555. 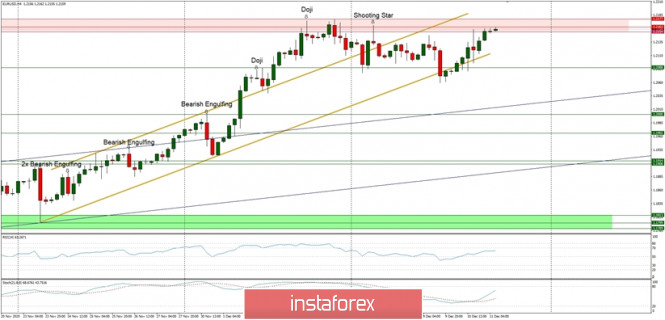
Indicator analysis. Daily review for the GBP/USD currency pair 11/12/2020 2020-12-11 Trend analysis (Fig. 1). Today, from the level of 1.3297 (the closing of yesterday's daily candle), the market will try to continue moving up with the target of 1.3363 which is a pullback level of 85.4% (red dotted line). When this line is reached, the price can continue to move up with the target of 1.3494 which is the resistance line (red bold line). 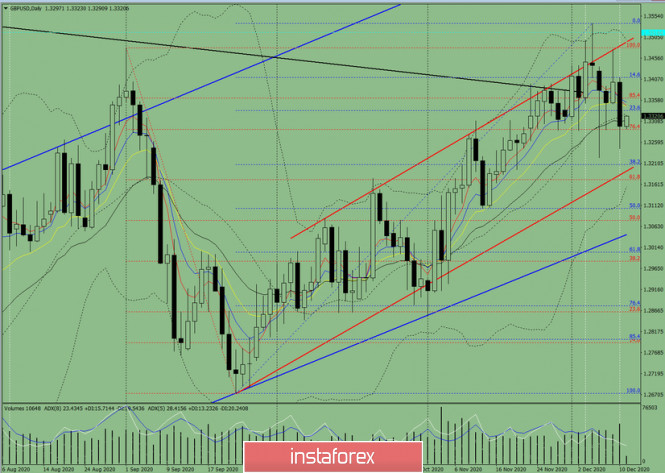 Figure 1 (daily chart). Complex analysis: - Indicator Analysis – up
- Fibonacci Levels – up
- Volumes – up
- Candle Analysis – up
- Trend Analysis – up
- Bollinger Bands – up
- Weekly Chart – up
General conclusion: Today, from the level of 1.3297 (the closing of yesterday's daily candle), the price will try to continue moving up with the target of 1.3363 which is a pullback level of 85.4% (red dotted line). When this line is reached, the price can continue to move up with the target of 1.3494 which is the resistance line (red bold line). Alternative scenario: After moving up and reaching the target of 1.3363, which is a pullback level of 85.4% (red dotted line), the price may start moving down with the target of 1.3245 which is the lower fractal (the daily candle from 10/12/2020). Elliott wave analysis of EUR/JPY for December 11, 2020 2020-12-11 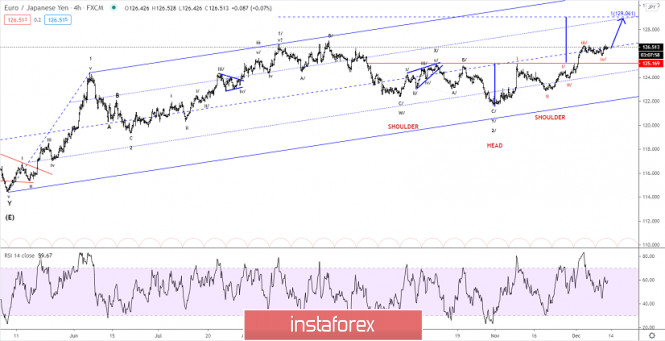
EUR/JPY is ready to break out from the latest consolidation for the next impulsive rally towards 129.06 as the next upside target. A break above 126.66 will constituate the break out of the consolidation and renewed upside progress. Short-term support is seen at 126.20 and again at 126.00. R3: 128.05 R2: 127.75 R1: 127.30 Pivot: 126.66 S1: 126.20 S2: 126.00 S3: 125.83 Trading recommendation: We are long EUR from 123.43 and we raised our stop to 125.80. Technical Analysis of GBP/USD for December 11, 2020 2020-12-11 Technical Market Outlook: The GBP/USD pair has reversed lower after the bounce and is testing the key technical support seen at the level of 1.3264 again. The last technical support is located at 1.3240, so if the demand zone located between the levels of 1.3264 - 1.3240 is clearly violated, then the outlook will change to bearish. The momentum is weak and negative already and the bearish pressure is getting stronger. The higher time frame trend remains up. Weekly Pivot Points: WR3 - 1.3800 WR2 - 1.3667 WR1 - 1.3552 Weekly Pivot - 1.3410 WS1 - 1.3307 WS2 - 1.3172 WS3 - 1.3057 Trading Recommendations: The GBP/USD pair is in the down trend on the monthly time frame, but the recent bounce from the low at 1.1411 made in the middle of March 2020 looks very strong and might be a reversal swing. In order to confirm the trend change, the bulls have to break through the technical resistance seen at the level of 1.3518. All the local corrections should be used to enter a buy orders as long as the level of 1.2674 is not broken. 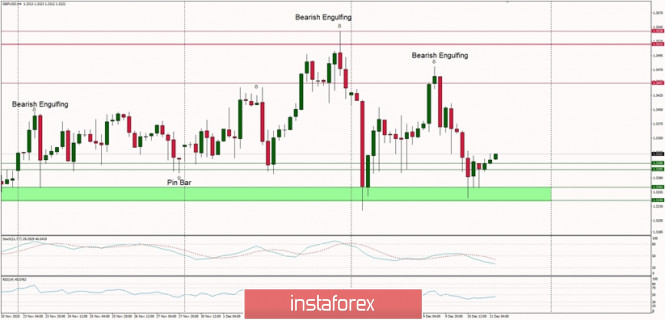
Elliott wave analysis of GBP/JPY for December 11, 2020 2020-12-11 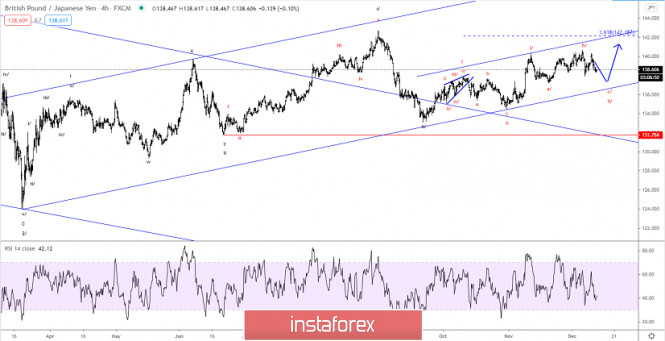
We continue to look for more consolidation and a dip to 137.17 before the next push higher through 140.37 towards the former peak at 142.70. GBP/JPY is currently testing solid support at 138.25 and after a minor reaction to 138.88 renewed downside pressure through support at 138.25 is expected for a dip to 137.17. Resistance is currently seen at 138.88 and again at 139.31 R3: 139.65 R2: 139.31 R1: 138.88 Pivot: 138.64 S1: 138.25 S2: 137.79 S3: 137.17 Trading recommendation: We are short GBP from 138.95 with our stop placed at 139.95. We will take profit at 137.25 AUD/USD. AUD has updated another high and is ready to reach new peaks 2020-12-11 The Australian dollar continues to update records: In a pair with the US currency, it completed updating the high earlier than expected, settling within the 75th mark and breaking the resistance level of 0.7550 (upper line of the Bollinger Bands indicator on the daily and weekly time frames). Moreover, none of the experts doubted that the AUD would take this price level, but few currency strategists think that a successful attack happened so quickly. All previous price barriers were not easy for the Australian dollar. The buyers of AUD/USD tried to reach the level of 0.70 for several weeks, followed by the 72nd and 74th mark. At the same time, the upward movement was based on the principle of "one step forward, two steps back". However, the correctional downward pullbacks allowed traders to go into buy at a more favorable price, so it is slightly unfair to complain about such price dynamics of AUD/USD. 
The general fundamental background for the pair currently contributes to the further growth of the Australian dollar. At the same time, it should be recalled that the pair impulsively reached multi-month highs – the last time the price was at such highs was in June 2018. The previous impulse growth indicates a correction, therefore, it is worth waiting for purchases today, especially given the Friday factor. It is also very likely that traders will take profits before this trading week ends, without risking leaving open positions over the weekend. Therefore, a downward pullback for the pair is possible in the afternoon. However, in general, the upward trend remains in effect in the mid-term (and even more so long-term), which is not only due to the weakness of the US currency. The overall market optimism about the prospects for the global economic recovery, which is directly related to the vaccine against COVID-19, as well as the growth of the commodity market amid RBA's wait-and-see position, allow buyers of AUD/USD to expect to reach new price highs. The last factor that contributes to this growth is Australia's coronavirus successes. This country lifted quarantine at the end of autumn. The reason for yesterday's rise in the AUD/USD pair was the dollar's weakness, which plummeted again across the market. Different factors such as a sharp surge in the number of initial applications for unemployment benefits (853 thousand), a weak and indistinct growth of US inflation and Fed members' dovish sentiment play against the USD. In addition, there is still a demand for risky assets in the currency market, while the safe dollar continues to lose its position. The general optimism is linked to hopes for overcoming the coronavirus crisis. The COVID-19 vaccine has already been tentatively approved in the United States, as well as in Canada and Bahrain. In the European Union, the regulator should issue its verdict (tentatively positive) next week, while vaccination is already in process in the UK. And although the coronavirus continues to update anti-records (both in the United States and in some European countries), the emerging positivity allows traders to ignore the disappointing medical statistics. On another note, the adoption of a new program to help the US economy will likely add optimism soon. According to US Treasury Secretary, Mr. Steven Mnuchin, there has been progress to the negotiations on new incentives. Ms. Nancy Pelosi, House Speaker, also reiterated the same statement. On the one hand, politicians have repeatedly voiced similar statements, then accuse each other of non-compliance. On the other hand, Congressmen need to pass this important bill before this year ends, since many Federal aid programs expire on December 31. The Australian dollar, in turn, received support from the commodity market. Prices for a strategically important commodity (iron ore), reached their highest level in seven years this week, driven by China's strong demand. Experts say that steel production in China is increasing, while on the contrary, the reserves of iron ore in the country are being reduced. But amid sustained high demand from Chinese steelmakers and concerns about a supply shortage in the first quarter of next year, iron ore's prices soared, providing indirect support to the Australian dollar. 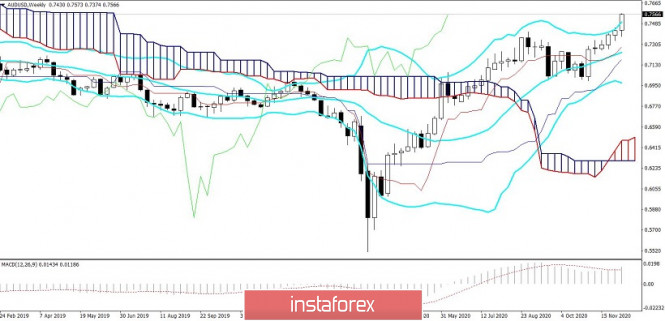
Thus, the fundamental background for the AUD/USD pair contributes to further growth of the Australian dollar. Longs can be opened from current positions, but considering the Friday factor and the previous impulse price growth, it is better to take a wait-and-see position at the moment and expect for a corrective pullback. The target for the upward movement is the "round" level of 0.7600. The next resistance level is at 0.7650. Technically, the Ichimoku indicator formed a bullish Parade Line signal on the H4, D1 and W1 time frames, and the price is located on the upper line of the Bollinger Bands indicator, which also indicates the priority of the upward movement. Forex forecast 12/11/2020 on EUR/GBP, SP500, DowJones and Bitcoin from Sebastian Seliga 2020-12-11 In the last trading day, let's take a look at the EUR/GBP pair, SP500 and Dow Jones indices and Bitcoin at the daily time frame charts.
Author's today's articles: Maxim Magdalinin  In 2005 graduated from the Academy of the Ministry of Internal Affairs of the Republic of Belarus, law faculty. Worked as a lawyer for three years in one of the biggest country's company. Besides the trading, he develops trading systems, writes articles and analytical reviews. Works at stock and commodity markets explorations. On Forex since 2006. In 2005 graduated from the Academy of the Ministry of Internal Affairs of the Republic of Belarus, law faculty. Worked as a lawyer for three years in one of the biggest country's company. Besides the trading, he develops trading systems, writes articles and analytical reviews. Works at stock and commodity markets explorations. On Forex since 2006. Sergey Belyaev  Born December 1, 1955. In 1993 graduated from Air Force Engineering Academy. In September 1999 started to study Forex markets. Since 2002 has been reading lectures on the technical analysis . Is fond of research work. Created a personal trading system based on the indicator analysis. Authored the book on technical analysis "Calculation of the next candlestick". At present the next book is being prepared for publishing "Indicator Analysis of Forex Market. Trading System Encyclopedia". Has created eleven courses on indicator analysis. Uses classical indicators. Works as a public lecturer. Held numerous seminars and workshops presented at international exhibitions of financial markets industry. Is known as one of the best specialists in the Russian Federation researching indicator analysis. Born December 1, 1955. In 1993 graduated from Air Force Engineering Academy. In September 1999 started to study Forex markets. Since 2002 has been reading lectures on the technical analysis . Is fond of research work. Created a personal trading system based on the indicator analysis. Authored the book on technical analysis "Calculation of the next candlestick". At present the next book is being prepared for publishing "Indicator Analysis of Forex Market. Trading System Encyclopedia". Has created eleven courses on indicator analysis. Uses classical indicators. Works as a public lecturer. Held numerous seminars and workshops presented at international exhibitions of financial markets industry. Is known as one of the best specialists in the Russian Federation researching indicator analysis. Sebastian Seliga  Sebastian Seliga was born on 13th Oсtober 1978 in Poland. He graduated in 2005 with MA in Social Psychology. He has worked for leading financial companies in Poland where he actively traded on NYSE, AMEX and NASDAQ exchanges. Sebastian started Forex trading in 2009 and mastered Elliott Wave Principle approach to the markets by developing and implementing his own trading strategies of Forex analysis. Since 2012, he has been writing analitical reviews based on EWP for blogs and for Forex websites and forums. He has developed several on-line projects devoted to Forex trading and investments. He is interested in slow cooking, stand-up comedy, guitar playing, reading and swimming. "Every battle is won before it is ever fought", Sun Tzu Sebastian Seliga was born on 13th Oсtober 1978 in Poland. He graduated in 2005 with MA in Social Psychology. He has worked for leading financial companies in Poland where he actively traded on NYSE, AMEX and NASDAQ exchanges. Sebastian started Forex trading in 2009 and mastered Elliott Wave Principle approach to the markets by developing and implementing his own trading strategies of Forex analysis. Since 2012, he has been writing analitical reviews based on EWP for blogs and for Forex websites and forums. He has developed several on-line projects devoted to Forex trading and investments. He is interested in slow cooking, stand-up comedy, guitar playing, reading and swimming. "Every battle is won before it is ever fought", Sun Tzu Torben Melsted  Born in November 1962. Graduated from CBS, got Diploma in Finance. Began trading on Forex in 1986 and since that time held various positions such as advising clients, hedging client flows on FX and commodity markets. Also worked for major corporations as Financial Risk Manager. Uses Elliott wave analysis in combination with classic technical analysis, and has been using a Calmar Ratio of 5.0 for over 3 years. Has his own blog, where he uses Elliott wave and technical analysis on all financial markets. Born in November 1962. Graduated from CBS, got Diploma in Finance. Began trading on Forex in 1986 and since that time held various positions such as advising clients, hedging client flows on FX and commodity markets. Also worked for major corporations as Financial Risk Manager. Uses Elliott wave analysis in combination with classic technical analysis, and has been using a Calmar Ratio of 5.0 for over 3 years. Has his own blog, where he uses Elliott wave and technical analysis on all financial markets. Irina Manzenko  Irina Manzenko Irina Manzenko
Subscription's options management Theme's:
Fundamental analysis, Fractal analysis, Wave analysis, Technical analysis, Stock Markets
Author's :
A Zotova, Aleksey Almazov, Alexander Dneprovskiy, Alexandr Davidov, Alexandros Yfantis, Andrey Shevchenko, Arief Makmur, Dean Leo, Evgeny Klimov, Fedor Pavlov, Grigory Sokolov, I Belozerov, Igor Kovalyov, Irina Manzenko, Ivan Aleksandrov, l Kolesnikova, Maxim Magdalinin, Mihail Makarov, Mohamed Samy, Mourad El Keddani, Oleg Khmelevskiy, Oscar Ton, Pavel Vlasov, Petar Jacimovic, R Agafonov, S Doronina, Sebastian Seliga, Sergey Belyaev, Sergey Mityukov, Stanislav Polyanskiy, T Strelkova, Torben Melsted, V Isakov, Viktor Vasilevsky, Vladislav Tukhmenev, Vyacheslav Ognev, Yuriy Zaycev, Zhizhko Nadezhda
Edit data of subscription settings
Unsubscribe from the mailing list Sincerely,
Analysts Service | If you have any questions, you can make a phone call using one of the
InstaForex Toll free numbers right now:
|  | InstaForex Group is an international brand providing online trading services to the clients all over the world. InstaForex Group members include regulated companies in Europe, Russia and British Virgin Islands. This letter may contain personal information for access to your InstaForex trading account, so for the purpose of safety it is recommended to delete this data from the history. If you have received this letter by mistake, please contact InstaForex Customer Relations Department. |


Post a Comment
0Comments