| Simplified wave analysis and forecast for GBP/USD and USD/JPY on December 10 2020-12-10 GBP/USD Analysis: The upward section of the British pound chart from September 10 completes the bullish wave construction of a larger time frame. After the hidden correction ended on December 7, a reversal model is formed for the next breakthrough in the main exchange rate. Forecast: Today, in the first half of the day, a flat mood of movement with a downward vector is likely. The decline is likely no further than the estimated support. At the end of the day, you can expect activation and a return to the bullish direction. Potential reversal zones Resistance: - 1.3420/1.3450 Support: - 1.3310/1.3280 Recommendations: Until the decline is complete, trading on the pound market may become unprofitable. We recommend skipping this section and looking for buy signals at the end of it. 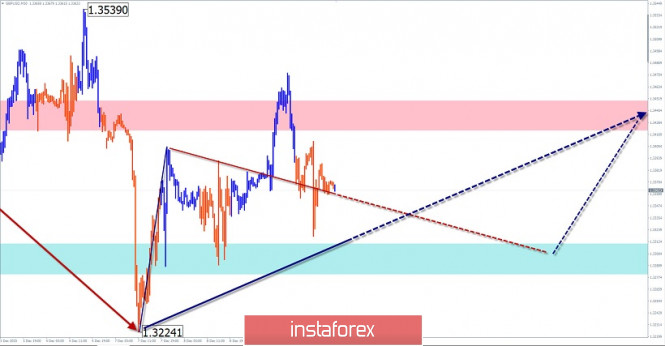
USD/JPY Analysis: A downward trend is forming in the Japanese yen market. Its last section counts down from November 9. The wave develops mainly in the lateral plane. On December 3, the formation of the correction phase of the movement began. Forecast: A general flat mood is expected today. In the first half of the day, you can expect an upward vector. The calculated resistance is located at the lower border of the potential reversal zone of the higher TF. A reversal and downward movement of the price is likely at the end of the day or tomorrow. Potential reversal zones Resistance: - 104.70/105.00 Support: - 104.10/103.80 Recommendations: Trading on the pair's market is only possible within an intra-session. Purchases are risky. It is recommended to track reversal signals for selling the pair in the area of the calculated resistance. 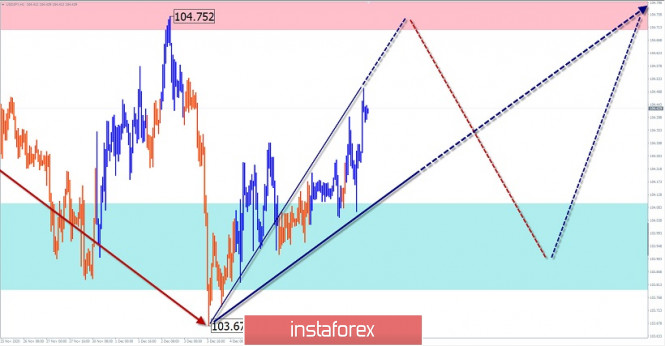
Explanation: In the simplified wave analysis (UVA), waves consist of 3 parts (A-B-C). The last incomplete wave is analyzed. The solid background of the arrows shows the formed structure, and the dotted background shows the expected movements. Note: The wave algorithm does not take into account the duration of the instrument's movements in time! Technical Analysis of EUR/USD for December 10, 2020 2020-12-10 Technical Market Outlook: The EUR/USD pair has fallen out of the acceleration channel as the corrective cycle continues. The local low was made at the level of 1.2059, just below the intraday technical support seen at 1.2088 and since then not much changed and no new developing occurred. Any further violation of the local low at 1.2059 will be bearish, so the market participants should keep an eye on the level of 1.2000 again. Please notice, the momentum is now hovering around the neutral level of fifty and the market is coming of the overbought conditions. Weekly Pivot Points: WR3 - 1.2496 WR2 - 1.2335 WR1 - 1.2244 Weekly Pivot - 1.2088 WS1 - 1.1996 WS2 - 1.1828 WS3 - 1.1738 Trading Recommendations: Since the middle of March 2020 the main trend is on EUR/USD pair has been up. This means any local corrections should be used to buy the dips until the key technical support is broken. The key long-term technical support is seen at the level of 1.1609. The key long-term technical resistance is seen at the level of 1.2555. 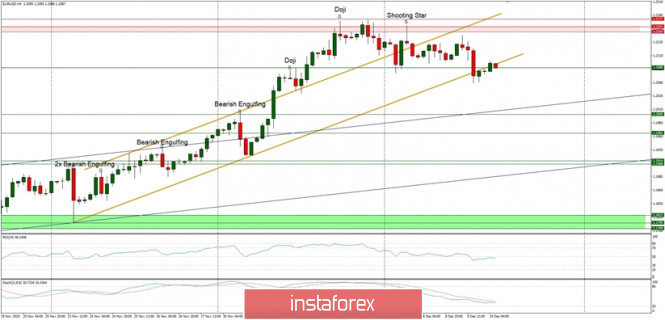
Technical Analysis of GBP/USD for December 10, 2020 2020-12-10 Technical Market Outlook: The GBP/USD pair has bounced high above all of the Fibonacci retracement levels and made a local high at the level of 1.3476. The bounce has ended with a Bearish Engulfing candlestick pattern at its top, so the bears are now pushing the price lower again. Nevertheless, this situation is only temporary and there is no indication of the up trend termination yet. The nearest technical support is located at 1.3306 and 1.3295. The strong and positive momentum supports the short-term bullish outlook, so only if the demand zone located between the levels of 1.3264 - 1.3240 is clearly violated, then the outlook will change to bearish. Weekly Pivot Points: WR3 - 1.3800 WR2 - 1.3667 WR1 - 1.3552 Weekly Pivot - 1.3410 WS1 - 1.3307 WS2 - 1.3172 WS3 - 1.3057 Trading Recommendations: The GBP/USD pair is in the down trend on the monthly time frame, but the recent bounce from the low at 1.1411 made in the middle of March 2020 looks very strong and might be a reversal swing. In order to confirm the trend change, the bulls have to break through the technical resistance seen at the level of 1.3518. All the local corrections should be used to enter a buy orders as long as the level of 1.2674 is not broken. 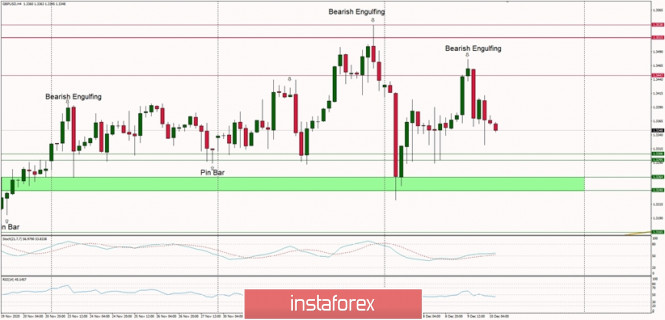
Indicator analysis. Daily review for the EUR/USD currency pair 10/12/2020 2020-12-10 Yesterday, the pair moved down and tested the historical support level of 1.2073 (blue dotted line). News on the market is expected at 12:45, 13:30 (Euro) and 13:30 UTC (Dollar). It is possible to continue working downwards but the outcome will depend on the news released at 12:45 and 13:30 UTC for the Euro. Trend analysis (Fig. 1). Today, from the level of 1.2081 (the closing of yesterday's daily candle), the market can continue to move down with the goal of 1.2041 which is a pullback level of 23.6% (red dotted line). When testing this level, it is possible to work down with the target of 1.1987 – 21 average EMA (black thin line). 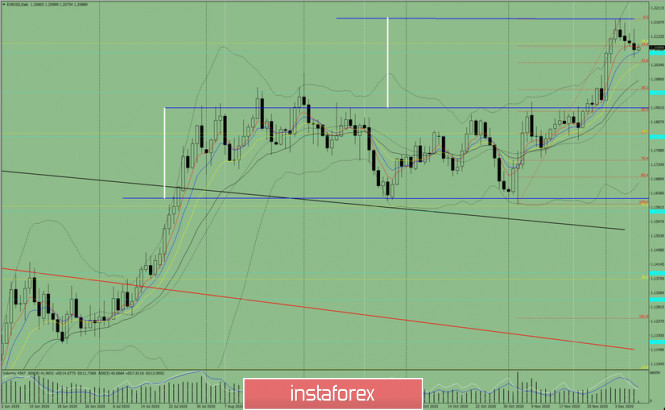 Figure 1 (daily chart). Complex analysis: - Indicator Analysis – down
- Fibonacci Levels – down
- Volumes – down
- Technical Analysis – down
- Trend Analysis – down
- Bollinger Bands – down
- Weekly Chart – down
General conclusion: Today, from the level of 1.2081 (the closing of yesterday's daily candle) the market can continue to move down with the goal of 1.2041 which is a pullback level of 23.6% (red dotted line). When testing this level, it is possible to work down, with the target of 1.1987 – 21 average EMA (black thin line). Alternative scenario: From the level of 1.2081 (the closing of yesterday's daily candle), an upward movement may begin with the target of 1.2147 which is the upper fractal (the daily candle from 09/12/2020). When testing this level, it is possible to work upwards with the target of 1.2177 which is the resistance level (blue thick line). AUD/USD. RBA report and China's deflation failed to break AUD's key target of 0.7550 2020-12-10 The AUD/USD pair continues to gain momentum, approaching the level of 0.75. At the moment, the Australian dollar is testing the resistance level of 0.7480 (upper line of the Bollinger Bands indicator on the daily chart). The breakdown of which will open the way to the next price resistances – 0.7500 and 0.7550 (upper line of the Bollinger Bands on the monthly chart, coinciding with the lower limit of Kumo clouds). The upward trend of the indicated pair is still strong, so it is very likely that the Australian currency will reach higher peaks in the near future. It should be recalled that the pair is growing not only due to the US dollar's general weakness, but also due to the Australian dollar's strengthening. On the other hand, RBA's rhetoric is pushing up the AUD, with the USD bulls' approval, which failed to reverse the trend. 
During last Friday's Asian session, there was a publication of Reserve Bank of Australia's quarterly report, which turned out to be quite good, despite the listed risks and concerns about a slow recovery of the labor market. The central bank focused on the high level of underemployment once again, predicting that the unemployment rate would be above 6% for another one and a half to two years. According to the indicator, this fact will be reflected in the dynamics of wages growth. At the same time, economists calculated that wages are expected to grow by less than 2% in the coming year and 2022; whereas, inflation growth in basic terms will only be 1% next year and 1.5% in 2022, which is significantly lower than the RBA's inflation target. It was shown that the above arguments are pessimistic. However, the following conclusions of the regulator in the context of the RBA's monetary policy prospects allow traders to ignore this pessimism, especially amid the latest published data on the growth of the Australian labor market. It should be recalled that the growth rate in the number of employed soared, reaching 178 thousand (against the forecasted decline of 29 thousand). This is the strongest growth rate since June this year, when Australia began to lift the lockdown, and this despite the fact that the latest data cover in that period is when Victoria, largest state in the country, observed strict quarantine – in particular, curfew was in effect in Melbourne with almost 5 million population. Given this fact, we can assume that the next Australian Non Farms will show a stronger result. Moreover, RBA members admitted in a report released today that the Australian economy is recovering at a faster pace than earlier forecasts, despite the voiced risks and concerns. A good argument in this case is the released data on the country's economic growth in Q3. Here, the key indicators appeared in the "green zone", significantly exceeding the forecast values. As one of the RBA's representatives recently noted, the coronavirus crisis affected the Australian economy very much, but the worst-case scenario did not happen in the country. The regulator made it clear that it will maintain a wait-and-see attitude in the coming months. As a result, AUD/USD traders did not focus on the pessimistic ideas of the document. In general, buyers of the pair have recently shown an amazing "stress tolerance": for example, they ignored China's weak data yesterday. China's deflation was recorded for the first time in the past 11 years. The November CPI came out at -0.5%, last time such dynamics was at such lows was during the global economic crisis of 2008-2009. As a rule, the Australian dollar reacts quite sharply to the declines of the Chinese indicators, especially since we are talking about a multi-year anti-record. However, it only showed a slight correction, and resumed its growth just a few hours later. This suggests that AUD/USD buyers use corrective pullbacks to open longs, thereby pushing the pair to new price levels. 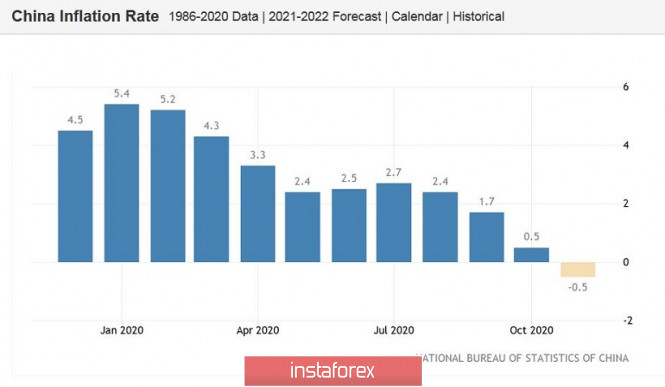
The US dollar, in turn, enjoys occasional demand only during periods of uncertainty and/or amid rising anti-risk sentiments. Yesterday, USD bulls tried to take the lead, taking advantage of the situation in the US Congress. The fact is that Congressmen continue to argue over the scale of the stimulus package. Democratic representatives believe that the amount of support should exceed $ 2 trillion, while the Republicans insist on the amount of no more than one billion. The debate around this issue has been going on for months, so the reaction of traders has somewhat dulled. For this reason, the dollar bulls were unable to develop a large-scale offensive yesterday, limiting themselves to a modest correction. Nevertheless, the AUD/USD pair continued upwards. Today, all the attention of the pair's traders will be focused on the data about US inflation growth. According to forecasts, the general consumer price index on monthly terms in November should reach 0.1% (after falling to zero), and rise to 1.3% in annual terms. At the same time, core inflation should show similar dynamics: + 0.2% in monthly terms and growth to 1.6% in annual terms. The forecasts are relatively good, but there is also a downside. If traders' expectations on inflation are not met, the US dollar might be under significant pressure again. This fact will allow AUD/USD buyers not only to break through the resistance level of 0.7480, but also enter the area of 0.75 level. Thus, if we talk about the medium-term period, we can consider longs from the current position, with the first target of 0.7480 and the main target of 0.7550. The technical prospect of AUD/USD pair also talks about the priority of buy: the pair is located between the middle and upper lines of the Bollinger Bands indicator, as well as above all the lines of the Ichimoku indicator on the H4, D1 and W1 time frames. Technical analysis of AUD/USD for December 10, 2020 2020-12-10 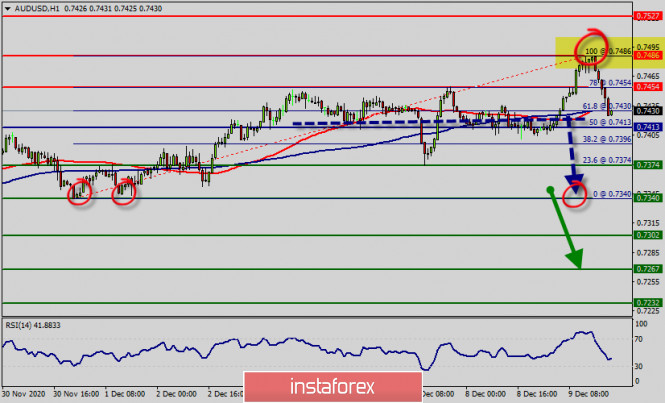 Technical Overview : The AUD/USD pair has extended its rally to the top of 0.7486 yesterday. But the pair has rebounded from the top of 0.7486 to close at 0.7432 - ending it a handful of pips below it. Upside momentum in the AUD/USD pair is bit unconvincing as seen in 1-hour RSI. But further drop is expected as long as 0.7486 major resistance holds. The Australian dollar has been steadily but painfully advancing against its American rival, and the main reason behind it seems to be the tepid tone of strong news. On the downside, however, break of 0.7413 will indicate short term topping and turn bias back to the downside for pull back. Otherwise, current rebound from 0.7486 could still turn out to be a correction in the long term down trend. The AUD/USD pair is trying to get below the nearest resistance level at 0.7486. Price has dropped absolutely perfectly from our selling area yesterday and has since made an intermediate recovery. We're back to testing our major resistance again and we look to sell below 0.7486 (100% ofFibonacci retracement, horizontal overlap resistance, bearish divergence, last bullish wave, top point) for a strong drop towards 0.7413 support (Fibonacci retracement) first. RSI is close to the overbought territory but there is still some room to gain momentum in case the right catalysts emerge. A move below the support at 0.7413 will push the AUD/USD pair towards the next support level at 0.7374. The AUD/USD pair fell sharply from the level of 0.7486 towards 0.7430. Now, the price is set at 0.7432. The resistance is seen at the level of 0.7486 and 0.7527. Moreover, the price area of 0.7486/0.7527 remains a significant resistance zone. Therefore, there is a possibility that the AUD/USD pair will move downside and the structure of a fall does not look corrective. The trend is still below the 100 EMA for that the bearish outlook remains the same as long as the 100 EMA is headed to the downside. Thus, amid the previous events, the price is still moving between the levels of 0.7486 and 0.7413. If the NZD/USD pair fails to break through the resistance level of 0.7486, the market will decline further to 0.7413 as as the first target. This would suggest a bearish market because the RSI indicator is still in a negative spot and does not show any trend-reversal signs. The pair is expected to drop lower towards at least 0.7374 so as test the daily support 1. If the trend breaks the minor support at 0.7374 , the pair will move downwards continuing the bearish trend development to the level of 0.7340 in order to test the daily support 2. Overall, we still prefer the bearish scenario which suggests that the pair will stay below the zone of 0.7413 this week. So it will be good to resell at 0.7413 with the first targets of 0.7374, 0.7340. It will also call for a downtrend in order to continue towards 0.7267. The strong weekly support is seen at 0.7267. On the contrary, if a breakout takes place at the resistance level of 0.7527, then this scenario may become invalidated. Technical analysis of USD/JPY for December 10, 2020 2020-12-10 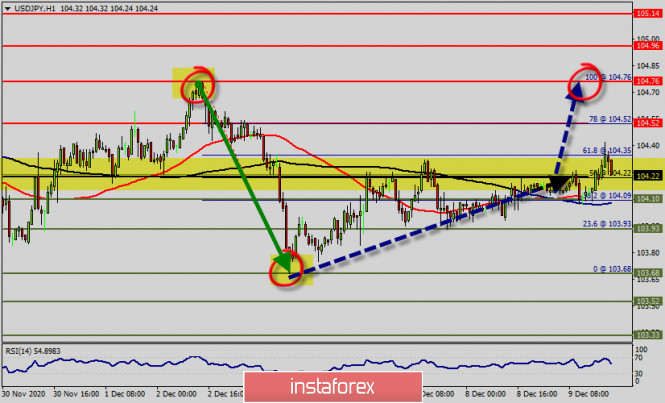
Technical Overview : The USD/JPY pair showed a massive bullish price swing this week. The bulls were even able to reach the top level of 104.35. The U.S. Dollar is trading higher against the Yen after reversing earlier losses. So, the USD/JPY uptrend is currently very strong. The USD/JPY pair has been reveling some good strength over the last several months as cheap money is flowing into the markets. The USD/JPY pair is still calling for a strong bullish market as long as the trend is trading above the spot of 103.68. Considering that the RSI remains bullish on all timeframes and the US Dollar Index is still trading in an upward channel since the 1st of Decemeber, we could see the USD/JPY pair making fresh 104.22 highs. Next resistance level for the bulls to watch is at 104.76, Decemeber, 2, 2020 highs. An additional signal in favor of reducing the USD/JPY pair currency pair will be a rebound from the trend line on the relative strength index (RSI). The USD/JPY pair will continue to rise from the level of 104.22. The support is found at the level of 104.22, which represents the 50% Fibonacci retracement level in the H1 time frame. The daily pivot is seen at the level of 104.22. The price is likely to form a double bottom. Today, the major support is seen at 104.10, while immediate resistance is seen at 104.52. Accordingly, the USD/JPY pair is showing signs of strength following a breakout of a high at 104.22. So, buy above the level of 104.22 with the first target at 104.76 in order to test the daily resistance 1 and move further to 104.96. Also, the level of 104.96 is a good place to take profit because it will form a new double top at the same time frame. Amid the previous events, the pair is still in an uptrend; for that we expect the USD/JPY pair to climb from 104.22 to 104.96 today. From this point, we expect the USD/JPY pair to continue moving in the bullish trend from the support level of 104.22 towards the target level of 104.76. If the pair succeeds in passing through the level of 104.76, the market will indicate the bullish opportunity above the level of 104.96 so as to reach the major target at 105.14. At the same time, in case a reversal takes place and the USD/JPY pair breaks through the support level of 104.10, a further decline to 103.68 can occur, which would indicate a bearish market. Overall, we still prefer the bullish scenario, which suggests that the pair will stay above the are of 103.68 today (the market is still in an uptrend). Indicator Analysis. Daily review for the GBP/USD currency pair 12/10/20 2020-12-10 Yesterday, the pair went up and tested the resistance line at 1.3476 (red bold line) and then rolled back down, closing the daily candle at 1.3401. Today, the price will most likely continue to go down according to the economic calendar news, it is expected at 13.30 UTC (USD). Trend Analysis (Fig. 1). Today, the market will continue to go down from the level of 1.3401 (closing of yesterday's daily candle) with the target of 1.3312 - 21 average EMA (black thin line). After testing this line, it is possible to continue going down with the target of 1.3207 at the pullback level of 38.2% (blue dotted line). 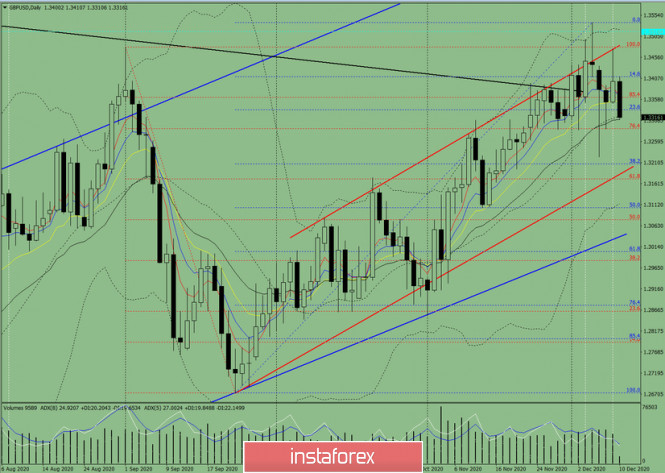
Figure 1 (daily chart). Complex Analysis: - Indicator Analysis – down
- Technical Analysis – down
General Conclusion: Today, the price will continue to go down from the level of 1.3401 (closing of yesterday's daily candle) with the target of 1.3312 - 21 average EMA (black thin line). After testing this line, it is possible to continue going down with the target of 1.3207 at the pullback level of 38.2% (blue dotted line). Alternative scenario: after going down and reaching the 21 average EMA of 1.3312 (black thin line), the pair may start going up with the target of 1.3486 at the resistance line (red bold line). GBP/USD. December 10. COT report. Ursula von der Leyen and Boris Johnson failed to revive the negotiations. 2020-12-10 GBP/USD – 1H. 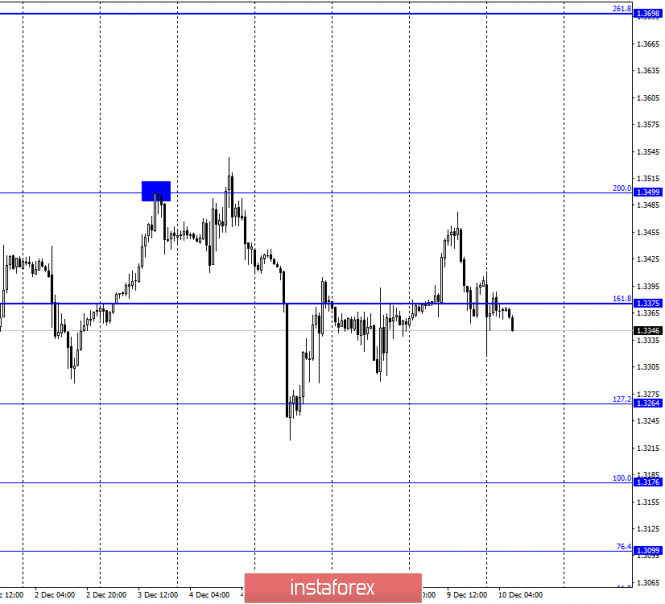
According to the hourly chart, the quotes of the GBP/USD pair performed a consolidation under the corrective level of 161.8% (1.3375), which allows traders to count on a further drop in quotes in the direction of the Fibo level of 127.2% (1.3264). And fixing the pair's rate below this level will increase the chances of falling towards the level of 100.0% (1.3176). The information background for the British remains negative. But at the same time, the British almost does not fall in price. The high reached on December 4 is the highest point for a Briton since May 2018. And this is although the "hard" Brexit is already 21 days away, and the parties still cannot agree on anything. What makes traders keep buying the pound (or at least keep long positions open) remains a mystery. But the fact remains. Last night, European Commission President Ursula von der Leyen and British Prime Minister Boris Johnson met in person. The meeting was organized to break the deadlock in the negotiations. The two officials had dinner together and declared "great differences remain". Did anyone doubt that the outcome of this dinner would be exactly that? What could Leyen and Johnson have agreed on in three hours if the groups of Michel Barnier and David Frost are working on an agreement almost around the clock without much success? However, the heads of the European Commission and the British government still held a meeting, which means "they are trying to find a way out of this situation". GBP/USD – 4H. 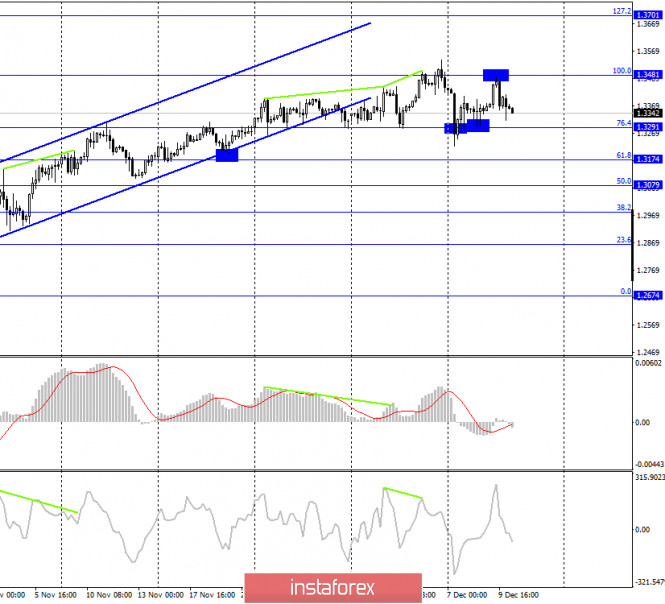
On the 4-hour chart, the GBP/USD pair performed a rebound from the corrective level of 100.0% (1.3481) and a reversal in favor of the US currency with a fall in the direction of the Fibo level of 76.4% (1.3291). The pair's rebound from this level will allow traders to count on a reversal in favor of the UK currency and the resumption of growth towards the level of 100.0%. Closing the rate at 1.3291 will increase the probability of a further fall towards the level of 61.8% (1.3174). GBP/USD – Daily. 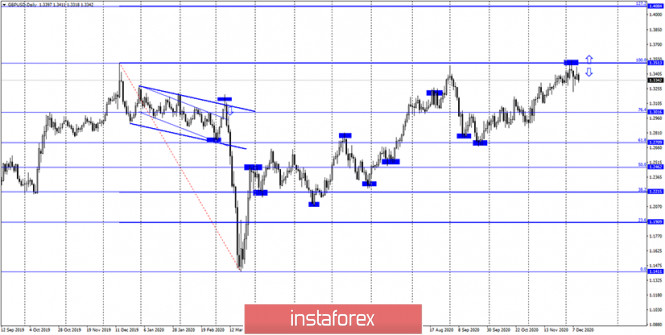
On the daily chart, the pair's quotes performed a rebound from the corrective level of 100.0% (1.3513). And this is the most important and clear signal on all charts. If the rebound is not false (and so far it does not look false), then the Briton is waiting for a noticeable drop. But much now depends on the information background. GBP/USD – Weekly. 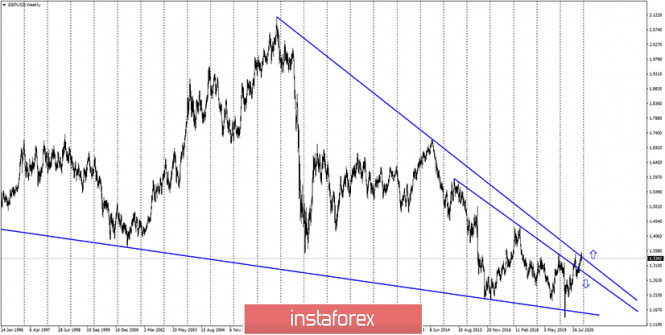
On the weekly chart, the pound/dollar pair performed an increase to the second downward trend line. A rebound from it in the long term will mean a reversal in favor of the US dollar and a long fall in the British dollar's quotes. Overview of fundamentals: There were no major economic reports in the UK and the US on Wednesday. However, traders remain fully focused on the topic of Brexit and trade negotiations between the UK and the EU. News calendar for the United States and the United Kingdom: UK - change in GDP (07:00 GMT). UK - change in industrial production (07:00 GMT). US - consumer price index (13:30 GMT). US - number of initial and repeated applications for unemployment benefits (13:30 GMT). On December 10, the UK has already released reports on GDP for October (+0.4%) and industrial production for October (+1.3%). The latest report was better than expected, but the British pound still started to fall. Traders are now paying more attention to trade negotiations, and everything is disappointing. Next up is the US inflation report. COT (Commitments of Traders) report: 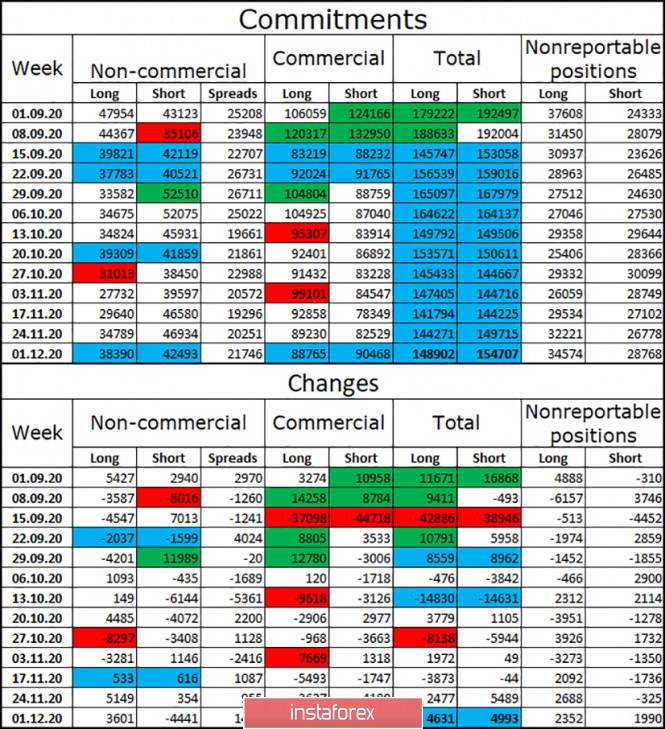
The latest COT report showed a new increase in the number of long contracts held by speculators. This time, their total number increased by 3,601 contracts, and the number of short-contracts decreased by 4,441 units. Thus, the mood of speculators has become much more "bullish". At the same time, this is a very rare situation. The number of long and short contracts focused on the hands of the "Non-commercial" and "Commercial" categories is almost equal. The same applies to data for all categories of major players. Thus, the market is now in balance, however, the future of the British is still more dependent on the outcome of trade negotiations between London and Brussels. Major traders will also adjust to these results. Thus, their mood may change very dramatically, based on the results of the negotiations. GBP/USD forecast and recommendations for traders: At this time, I recommend that you be extremely careful with opening any deals on the British. The pair continues to move very raggedly and often changes direction. I recommend making new purchases of the British dollar if the rebound from the level of 76.4% (1.3291) is completed with the target of 1.3481 on the 4-hour chart. I recommend selling the British dollar with a target of 61.8% (1.3174) if the close is made under the level of 76.4% on the 4-hour chart. Terms: "Non-commercial" - major market players: banks, hedge funds, investment funds, private, large investors. "Commercial" - commercial enterprises, firms, banks, corporations, companies that buy currency not for speculative profit, but for current activities or export-import operations. "Non-reportable positions" - small traders who do not have a significant impact on the price. Forex forecast 12/10/2020 on EUR/USD, GBP/USD and Gold from Sebastian Seliga 2020-12-10 Let's take a look at the technical picture of EUR/USD, GBP/USD and Gold at the daily time frame chart before the ECB interest rate decision and the high importance data release from the USA.
Author's today's articles: Vyacheslav Ognev  Vyacheslav was born on August 24, 1971. In 1993, he graduated from Urals State University of Economics in the Russian city of Ekaterinburg holding a degree in Commerce and Economics of Trade. In 2007, he started concentrating on the Russian stock market, trading stocks on the RTS Stock Exchange and futures contracts on FORTS. Since 2008 he has been engaged in analyzing Forex market and trading currencies. He is an author of a simplified wave analysis method. He has also developed a trading strategy. At present, Vyacheslav is a co-author of training materials on two web portals dedicated to Forex trading education. Interests: fitness, F1 "Experience is the best of schoolmasters, only the school fees are heavy." - Thomas Carlyle Vyacheslav was born on August 24, 1971. In 1993, he graduated from Urals State University of Economics in the Russian city of Ekaterinburg holding a degree in Commerce and Economics of Trade. In 2007, he started concentrating on the Russian stock market, trading stocks on the RTS Stock Exchange and futures contracts on FORTS. Since 2008 he has been engaged in analyzing Forex market and trading currencies. He is an author of a simplified wave analysis method. He has also developed a trading strategy. At present, Vyacheslav is a co-author of training materials on two web portals dedicated to Forex trading education. Interests: fitness, F1 "Experience is the best of schoolmasters, only the school fees are heavy." - Thomas Carlyle Sebastian Seliga  Sebastian Seliga was born on 13th Oсtober 1978 in Poland. He graduated in 2005 with MA in Social Psychology. He has worked for leading financial companies in Poland where he actively traded on NYSE, AMEX and NASDAQ exchanges. Sebastian started Forex trading in 2009 and mastered Elliott Wave Principle approach to the markets by developing and implementing his own trading strategies of Forex analysis. Since 2012, he has been writing analitical reviews based on EWP for blogs and for Forex websites and forums. He has developed several on-line projects devoted to Forex trading and investments. He is interested in slow cooking, stand-up comedy, guitar playing, reading and swimming. "Every battle is won before it is ever fought", Sun Tzu Sebastian Seliga was born on 13th Oсtober 1978 in Poland. He graduated in 2005 with MA in Social Psychology. He has worked for leading financial companies in Poland where he actively traded on NYSE, AMEX and NASDAQ exchanges. Sebastian started Forex trading in 2009 and mastered Elliott Wave Principle approach to the markets by developing and implementing his own trading strategies of Forex analysis. Since 2012, he has been writing analitical reviews based on EWP for blogs and for Forex websites and forums. He has developed several on-line projects devoted to Forex trading and investments. He is interested in slow cooking, stand-up comedy, guitar playing, reading and swimming. "Every battle is won before it is ever fought", Sun Tzu Sergey Belyaev  Born December 1, 1955. In 1993 graduated from Air Force Engineering Academy. In September 1999 started to study Forex markets. Since 2002 has been reading lectures on the technical analysis . Is fond of research work. Created a personal trading system based on the indicator analysis. Authored the book on technical analysis "Calculation of the next candlestick". At present the next book is being prepared for publishing "Indicator Analysis of Forex Market. Trading System Encyclopedia". Has created eleven courses on indicator analysis. Uses classical indicators. Works as a public lecturer. Held numerous seminars and workshops presented at international exhibitions of financial markets industry. Is known as one of the best specialists in the Russian Federation researching indicator analysis. Born December 1, 1955. In 1993 graduated from Air Force Engineering Academy. In September 1999 started to study Forex markets. Since 2002 has been reading lectures on the technical analysis . Is fond of research work. Created a personal trading system based on the indicator analysis. Authored the book on technical analysis "Calculation of the next candlestick". At present the next book is being prepared for publishing "Indicator Analysis of Forex Market. Trading System Encyclopedia". Has created eleven courses on indicator analysis. Uses classical indicators. Works as a public lecturer. Held numerous seminars and workshops presented at international exhibitions of financial markets industry. Is known as one of the best specialists in the Russian Federation researching indicator analysis. Irina Manzenko  Irina Manzenko Irina Manzenko Mourad El Keddani  Was born in Oujda, Morocco. Currently lives in Belgium. In 2003 obtained B.S. in Experimental Sciences. In 2007 obtained a graduate diploma at Institut Marocain Specialise en Informatique Applique (IMSIA), specialty – Software Engineering Analyst. In 2007–2009 worked as teacher of computer services and trainer in a professional school specializing in computer technologies and accounting. In 2005 started Forex trading. Authored articles and analytical reviews on Forex market on Forex websites and forums. Since 2008 performs Forex market research, and develops and implements his own trading strategies of Forex analysis (especially in Forex Research & Analysis, Currency Forecast, and Recommendations and Analysis) that lies in: Numerical analysis: Probabilities, equations and techniques of applying Fibonacci levels. Classical analysis: Breakout strategy and trend indicators. Uses obtained skills to manage traders' accounts since 2009. In April 2009 was certified Financial Technician by the International Federation of Technical Analysts. Winner of several social work awards: Education Literacy and Non-Formal Education (in Literacy and Adult Education in The National Initiative for Human Development). Was born in Oujda, Morocco. Currently lives in Belgium. In 2003 obtained B.S. in Experimental Sciences. In 2007 obtained a graduate diploma at Institut Marocain Specialise en Informatique Applique (IMSIA), specialty – Software Engineering Analyst. In 2007–2009 worked as teacher of computer services and trainer in a professional school specializing in computer technologies and accounting. In 2005 started Forex trading. Authored articles and analytical reviews on Forex market on Forex websites and forums. Since 2008 performs Forex market research, and develops and implements his own trading strategies of Forex analysis (especially in Forex Research & Analysis, Currency Forecast, and Recommendations and Analysis) that lies in: Numerical analysis: Probabilities, equations and techniques of applying Fibonacci levels. Classical analysis: Breakout strategy and trend indicators. Uses obtained skills to manage traders' accounts since 2009. In April 2009 was certified Financial Technician by the International Federation of Technical Analysts. Winner of several social work awards: Education Literacy and Non-Formal Education (in Literacy and Adult Education in The National Initiative for Human Development).
Languages: Arabic, English, French and Dutch.
Interests: Algorithm, Graphics, Social work, Psychology and Philosophy. Grigory Sokolov  Born 1 January, 1986. In 2008 graduated from Kiev Institute of Business and Technology with "Finance and Credit" as a major. Since 2008 has studied the behavior of various currency pairs and their correlation on Forex. In his works and trading practice he uses candlestick analysis and Fibonacci technique. Since 2009 has written analytical reviews and articles which are published on popular Internet resources. Interests: music, computers and cookery. "Out of five deadly sins of business and as a rule, the most widespread, excessive striving to get profit is the worst". P. Drucker Born 1 January, 1986. In 2008 graduated from Kiev Institute of Business and Technology with "Finance and Credit" as a major. Since 2008 has studied the behavior of various currency pairs and their correlation on Forex. In his works and trading practice he uses candlestick analysis and Fibonacci technique. Since 2009 has written analytical reviews and articles which are published on popular Internet resources. Interests: music, computers and cookery. "Out of five deadly sins of business and as a rule, the most widespread, excessive striving to get profit is the worst". P. Drucker
Subscription's options management Theme's:
Fundamental analysis, Fractal analysis, Wave analysis, Technical analysis, Stock Markets
Author's :
A Zotova, Aleksey Almazov, Alexander Dneprovskiy, Alexandr Davidov, Alexandros Yfantis, Andrey Shevchenko, Arief Makmur, Dean Leo, Evgeny Klimov, Fedor Pavlov, Grigory Sokolov, I Belozerov, Igor Kovalyov, Irina Manzenko, Ivan Aleksandrov, l Kolesnikova, Maxim Magdalinin, Mihail Makarov, Mohamed Samy, Mourad El Keddani, Oleg Khmelevskiy, Oscar Ton, Pavel Vlasov, Petar Jacimovic, R Agafonov, S Doronina, Sebastian Seliga, Sergey Belyaev, Sergey Mityukov, Stanislav Polyanskiy, T Strelkova, Torben Melsted, V Isakov, Viktor Vasilevsky, Vladislav Tukhmenev, Vyacheslav Ognev, Yuriy Zaycev, Zhizhko Nadezhda
Edit data of subscription settings
Unsubscribe from the mailing list Sincerely,
Analysts Service | If you have any questions, you can make a phone call using one of the
InstaForex Toll free numbers right now:
|  |  InstaForex Group is an international brand providing online trading services to the clients all over the world. InstaForex Group members include regulated companies in Europe, Russia and British Virgin Islands. This letter may contain personal information for access to your InstaForex trading account, so for the purpose of safety it is recommended to delete this data from the history. If you have received this letter by mistake, please contact InstaForex Customer Relations Department. |
Post a Comment
0Comments