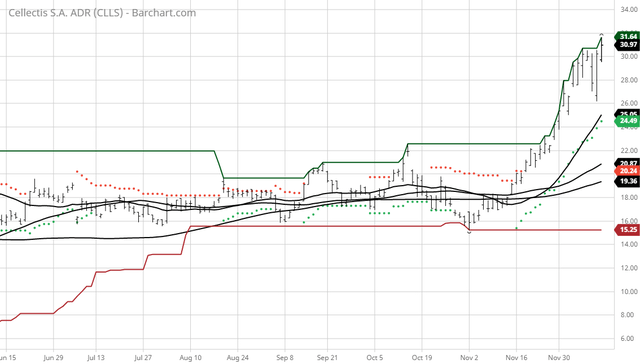
The Barchart Chart of the Day belongs to the gene editing company Cellectis (NASDAQ:CLLS). I found the stock by using Barchart's powerful screening tools to find the stocks with the highest Weighted Alpha and technical buy signals. After I sorted for the most frequent number of new highs in the last month, I used the Flipchart feature to review the charts for consistent prices appreciation. Since the Trend Spotter signaled a buy on 11/18 the stock gained 97.43%. Cellectis S.A., a clinical stage biotechnological company, develops immuno-oncology products based on gene-edited T-cells that express chimeric antigen receptors to target and eradicate cancer cells. It operates through two segments, Therapeutics and Plants. The company is developing UCART19, an allogeneic T-cell product candidate for the treatment of CD19-expressing hematologic malignancies, such as acute lymphoblastic leukemia (ALL); ALLO-501 to treat relapsed/refractory diffuse large B-cell lymphoma and follicular lymphoma; UCART123 for the treatment of acute myeloid leukemia (AML); and UCART22 to treat B-cell acute lymphoblastic leukemia. It is also developing UCARTCS1 and ALLO-715 for the treatment of multiple myeloma. In addition, the company produces high oleic soybean oil, other soybean products, and fiber wheat. It has strategic alliances with Allogene Therapeutics, Inc.; Les Laboratoires Servier; The University of Texas M.D. Anderson Cancer Center; and Iovance Biotherapeutics. The company was founded in 1999 and is headquartered in Paris, France. 
Barchart's Opinion Trading systems are listed below. Please note that the Barchart Opinion indicators are updated live during the session every 10 minutes and can therefore change during the day as the market fluctuates. The indicator numbers shown below therefore may not match what you see live on the Barchart.com website when you read this report. Barchart technical indicators: - 100% technical buy signal
- 104.15+ Weighted Alpha
- 97.43% gain in the last year
- Trend Spotter buy signal
- Above its 20, 50 and 100 day moving averages
- 15 new highs and up 76.58% in the last month
- Relative Strength Index 73.72%
- Technical support level at 27.42
- Recently traded at 31.04 with a 50 day moving average of 20.87
Fundmental factors: - Market Cap $1.28 billion
- Revenue expected to grow 219.40% this year
- Earnings estimated to increase 25.30% this year
- Wall Street analysts issued 4 strong buy, 1 buy and 1 hold recommendation on the stock
- The individual investors following the stock on Motley Fool voted 50 to 0 that the stock will beat the market
- 7,380 investors are monitoring the stock on Seeking Alpha
The Barchart Chart of the Day highlights stocks that are experiencing exceptional current price appreciation. They are not intended to be buy recommendations as these stock are extremely volatile and speculative. Should you decide to add one of these stocks to your investment portfolio it is highly suggested you follow a predetermined diversification and moving stop loss discipline that is consistent with your personal investment risk tolerance and reevaluate your stop losses at least on a weekly basis. |
Post a Comment
0Comments