| EUR/USD: plan for the European session on November 2. COT reports. Euro buyers under pressure. Bulls have nothing to catch 2020-11-02 To open long positions on EUR/USD, you need: The euro was under pressure after buyers made several unsuccessful attempts to turn the market over to their side due to the good fundamental data on the European economy. However, the new quarantine measures in the eurozone countries are likely to dash all hopes for a faster economic recovery, which could be observed in the third quarter of this year. Before talking about today's prospects for the pair's movement, let's look at the situation in the futures market, where the positive delta has been contracting for the fifth consecutive week. This once confirms the fact that the pair is in a downward trend, especially after the news about the partial lockdown of Germany and France. Great Britain joined the same countries over the weekend. The future prospects for the recovery of the European economy are now clouded due to the second wave of Covid-19, and no one knows how much the service sector will sink, which forces traders, if not to sell the euro, then clearly choose a wait-and-see attitude, especially against the background of the start of the presidential elections in the United States. The Commitment of Traders (COT) report for October 27 showed a reduction in both long and short positions. Despite this, buyers of risky assets believe that the bull market will continue and so they prefer to act with caution. Thus, long non-commercial positions fell from 229,878 to 217,443, while short non-commercial positions also fell to 61,888 from 63,935. The total non-commercial net position decreased to 155,555 from 165,943 a week earlier. However, the bullish sentiments for the euro remains rather high in the medium term. The more the euro will decline against the US dollar at the end of this year, the more attractive it will be for new investors, especially following the US presidential elections, when additional pressure on the market on this issue eases. Buyers of the euro have one task today, which is to regain control of the resistance at 1.1651, which will not be easy. Even with good data on the manufacturing sector of the eurozone countries, it is unlikely that the euro will be able to demonstrate large growth. Getting the pair to settle above 1.1651 and testing it from top to bottom will be a signal to open long positions in order to restore EUR/USD to the resistance area of 1.1701, where the moving averages play on the side of buyers. In this case, trading may move to a horizontal channel. If the bulls rise above 1.1701, the target of the bulls will be the high of 1.1754, where I recommend taking profits. If the euro is still under pressure, which is most likely, you can consider buying EUR/USD but only on condition of a false breakout at the 1.1617 level. In case of bad macroeconomic data, I recommend postponing long positions until we have tested the next low in the 1.1585 region, counting on a correction of 15-20 points within the day. To open short positions on EUR/USD, you need: Sellers need to form a false breakout in the resistance area of 1.1651, which will be another signal to open short positions in continuing the emerging trend. The first target will be a low of 1.1617, but I recommend that you only take profit after the pair reaches support at 1.1585. If the data on production activity manages to surprise traders, and the bears are not active in the resistance area of 1.1651, it is best to postpone sell positions until we have tested Friday's high at 1.1701, or open short positions immediately on a rebound from resistance at 1.1754, counting on a correction of 15-20 points within the day. 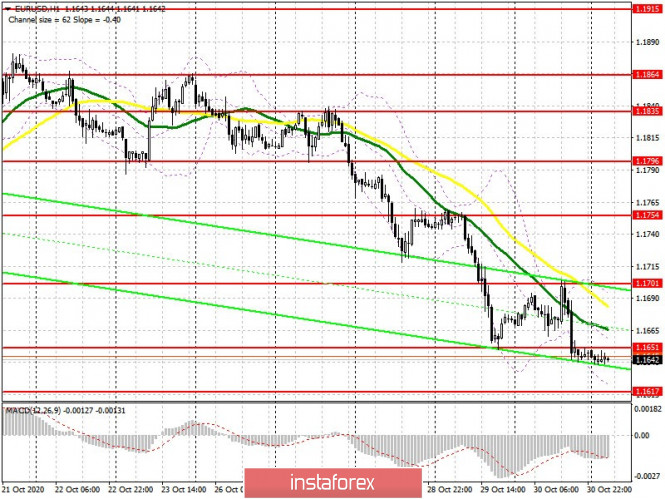 Indicator signals: Moving averages Trading is carried out below 30 and 50 moving averages, which indicates the continued pressure on the pair. Note: The period and prices of moving averages are considered by the author on the H1 hourly chart and differs from the general definition of the classic daily moving averages on the D1 daily chart. Bollinger Bands A breakout of the lower border of the indicator around 1.1617 will increase pressure on the euro. The breakout of the upper border in the 1.1701 area will lead to another attempt to strengthen the pair. Description of indicators - Moving average (moving average, determines the current trend by smoothing out volatility and noise). Period 50. It is marked in yellow on the chart.
- Moving average (moving average, determines the current trend by smoothing out volatility and noise). Period 30. It is marked in green on the chart.
- MACD indicator (Moving Average Convergence/Divergence — convergence/divergence of moving averages) Quick EMA period 12. Slow EMA period to 26. SMA period 9
- Bollinger Bands (Bollinger Bands). Period 20
- Non-commercial speculative traders, such as individual traders, hedge funds, and large institutions that use the futures market for speculative purposes and meet certain requirements.
- Long non-commercial positions represent the total long open position of non-commercial traders.
- Short non-commercial positions represent the total short open position of non-commercial traders.
- Total non-commercial net position is the difference between short and long positions of non-commercial traders.
GBP/USD: plan for the European session on November 2. COT reports. Bulls' attempts to regain control of the market remain unsuccessful 2020-11-02 To open long positions on GBP/USD, you need: The bears tried to continue the downward trend last Friday, taking support at 1.2918 in the first half of the day. The 5-minute chart shows that this level was tested from the bottom up, which led to producing a point of entry into short positions, however, it did not result in a major drop, and the market reversed. However, it was possible and necessary to sell on a rebound from the resistance of 1.2991 in the afternoon, which I mentioned in my morning forecast, which brought more than 50 points of profit. Changes are noticeable in the futures market, which play on the side of the sellers of the pound. But not that there are more people willing to sell the pound. Rather, the number of those who want to buy it have not increased. The fact that traders are closing both short and long positions indicates a wait-and-see attitude due to the next quarantine of the UK economy. Lack of clarity on the trade deal also does not add optimism and confidence to the buyers of the pound. The risk of introducing negative interest rates at the next meeting of the Bank of England in November also puts pressure on the British pound. The Commitment of Traders (COT) reports for October 27 showed a reduction in both short and long positions. Long non-commercial positions fell from 39,836 to 31,799. At the same time, short non-commercial positions fell from 41,836 to 38,459. As a result, the negative non-commercial net position was at -6 660, against -2000 a week earlier, which indicates that the sellers of the British pound retained control and also shows their minimal advantage in the current situation. 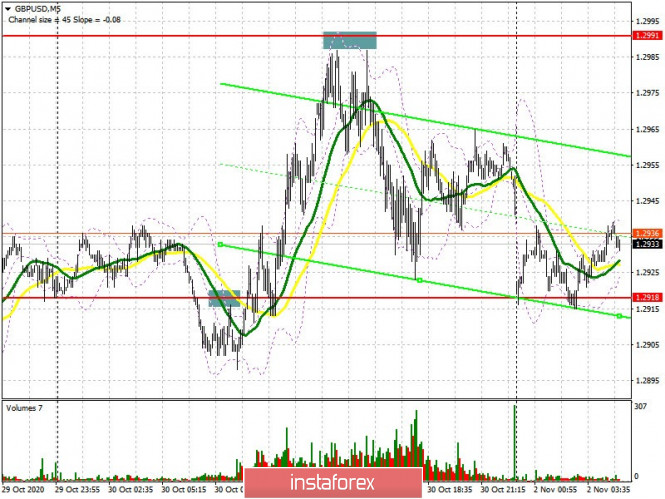 Buyers of the pound need to protect support at 1.2915 as soon as possible, since the pair's long term movement will depend on this. Forming a false breakout at this level in the first half of the day, together with good data on manufacturing activity in the UK, will lead to a wave of growth for the pound and a return to Friday's high of 1.2984. Getting the pair to settle above this range and having it tested from top to bottom forms a good signal to open long positions with the goal of rising to a high of 1.3058, where I recommend taking profits. In case buyers are not active around 1.2915, it is best not to rush into buy positions, as the data may disappoint traders. In this case, forming a false breakout in the support area of 1.2865 will be a signal to open long positions against the trend. I recommend buying the pound immediately on a rebound from the low of 1.2807, counting on a correction of 15-20 points within the day. To open short positions on GBP/USD, you need: Sellers need to regain the 1.2915 level, being able to settle below it will increase the pressure on the pair and could bring back the bear market, which temporarily paused last Friday. Testing the 1.2915 level from the bottom up, similar to Friday's entry point, will be a signal to open short positions in hopes to update the low of 1.2865, a breakdown of which may pose as a problem for the first time. Getting the pair to settle below this range will increase the pressure on the pound and lead to a larger sell-off to the 1.2807 low, where I recommend taking profits. In case GBP/USD grows in the first half of the day after the release of the production activity data, it is best to wait until the 1.2984 high has been tested, and forming a false breakout there will be a signal to open short positions. Selling the pound immediately on a rebound is possible from the resistance of 1.3058, counting on a correction of 20-30 points within the day. 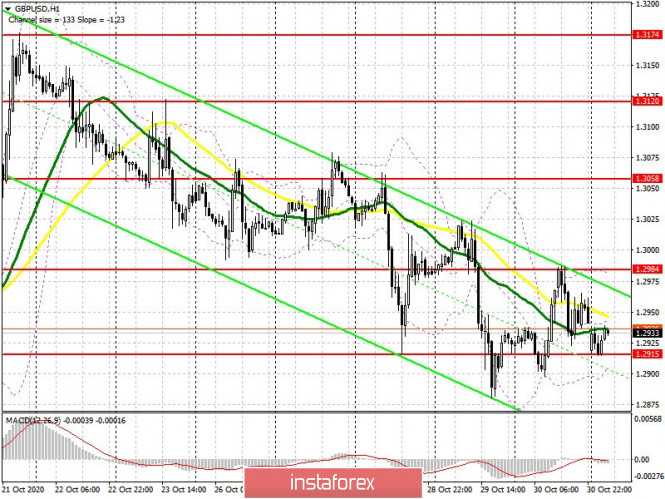 Indicator signals: Moving averages Trading is carried out just below 30 and 50 moving averages, which indicates a slight advantage for sellers of the pound. Note: The period and prices of moving averages are considered by the author on the H1 hourly chart and differs from the general definition of the classic daily moving averages on the daily D1 chart. Bollinger Bands A breakout of the lower border of the indicator in the 1.2910 area will increase the pressure on the pair. Growth will be limited by the upper level of the indicator in the 1.2984 area. Description of indicators - Moving average (moving average, determines the current trend by smoothing out volatility and noise). Period 50. It is marked in yellow on the chart.
- Moving average (moving average, determines the current trend by smoothing out volatility and noise). Period 30. It is marked in green on the chart.
- MACD indicator (Moving Average Convergence/Divergence — convergence/divergence of moving averages) Quick EMA period 12. Slow EMA period to 26. SMA period 9
- Bollinger Bands (Bollinger Bands). Period 20
- Non-commercial speculative traders, such as individual traders, hedge funds, and large institutions that use the futures market for speculative purposes and meet certain requirements.
- Long non-commercial positions represent the total long open position of non-commercial traders.
- Short non-commercial positions represent the total short open position of non-commercial traders.
- Total non-commercial net position is the difference between short and long positions of non-commercial traders.
Indicator analysis. Daily review on EUR/USD for November 2, 2020 2020-11-02 The pair traded downward on Friday and broke through 1.1651 - an 85.4% pullback level (red dotted line). Today, the price may continue to move down. As per the economic calendar, euro news is expected at 08:55 UTC, and dollar news at 15:00 UTC. Trend analysis (Fig. 1). The market may continue to move down from the level of 1.1647 (closing of Friday's daily candlestick) with the target at the support level 1.1612 (white thick line). If this line is tested, an upward trend is possible with the target at 1.1667 - a 14.6% pullback level (blue dashed line). 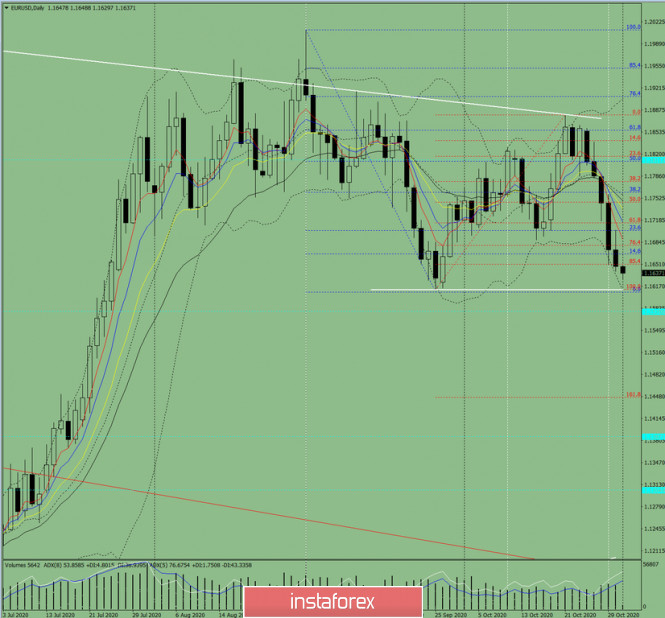
Figure: 1 (daily chart). Comprehensive analysis: - Indicator analysis - down; - Fibonacci levels - down; - Volumes - down; - Candlestick analysis - down; - Trend analysis - down; - Bollinger lines - up; - Weekly chart - down. General conclusion: Today, the price may move downward with the target at the lower fractal 1.1612 (white bold line). If this line is tested, an upward trend is possible with the target at 1.1667 – a 14.6% pullback level (blue dashed line). Another possible scenario: from the level of 1.1647, the price may move downward with the target at the lower fractal 1.1612 (white bold line). If this line is tested, the downward movement will continue with the target at the historical support level 1.1579 (blue dotted line). Brief trading recommendations for the EUR/USD pair on 11/02/20 2020-11-02 
The EUR/USD pair was able to maintain the previously set downward movement last Friday. This resulted in a consolidation of the quotes below the support level of 1.1650, which gives a signal for an even huge decline of the European currency in the long term. Looking at trading signals in detail, it can identify the main levers for sellers: The technical analysis is based on a consistent decline, where the price managed to break through several important support levels (1.1810; 1.1700 and 1.1650), which may indicate the prevailing downward interest in the market. The fundamental analysis comes from the negative COVID-19 background, where the rapid rise of new cases is forcing European countries to tighten quarantine measures, which leads to a similar scenario that happened in spring and an economic downturn. Regarding the quote's current location, it can be seen that the price is consolidating below the level of 1.1650, which increases the chances of reaching and breaking the local low (1.1612) from September 25. We can assume that if the price consolidates below 1.1612, it will lead to even more hype on sellers' part, which may lead to the restoration of the downward course set in the September period. In such a scenario, the market development prospect considers a consistent change in the price trend from an upward to a downward one. The price coordinates of the possible prospects are 1.1550; 1.1350; 1.1180; 1.1000. Alternatively, we can consider a natural price rebound from the area of the local low (1.1612) on September 25. In this case, there will be a slowdown followed by a pullback/correction, where the downward interest will likely remain in the market. Looking closely, the market is more focused on further weakening the euro. 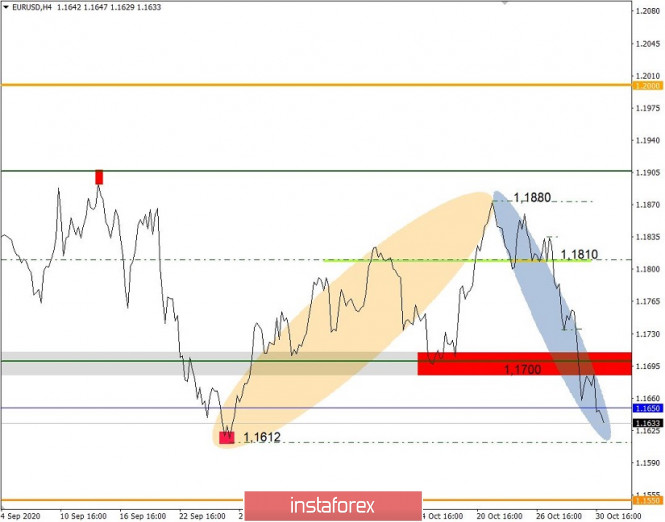
Trading plan for the EUR/USD pair on November 2. Persistent rise of COVID-19; Strong resistances in the euro. 2020-11-02 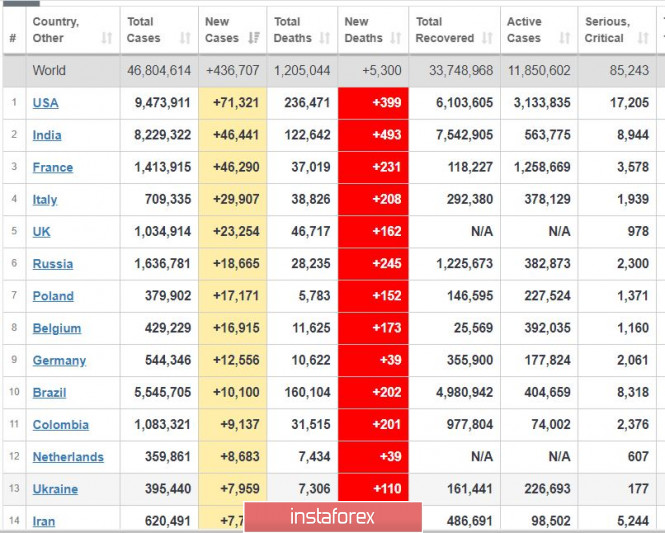
A world record of 573 thousand new COVID-19 cases was observed two days ago, but thankfully it fell to 475 thousand the very next day. At the moment, it has decreased to 436 thousand, however, it is still way higher than the peak record during the earlier pandemic wave. The highest incidence at this time is still from the United States, at 101 thousand cases per day. As for Europe, everything remains bad. Thus, new quarantine restrictions have been introduced in Belgium, Czech Republic and Austria. If the situation does not improve, Italy will undergo a lockdown as well, the same as what Britain has implemented already. For Germany, small businesses have been closed to minimize contact and the spread of the virus. With regards to the vaccine, one is expected to be available at the end of November, however, its effect will only be noticeable no earlier than a month after the start of vaccination. 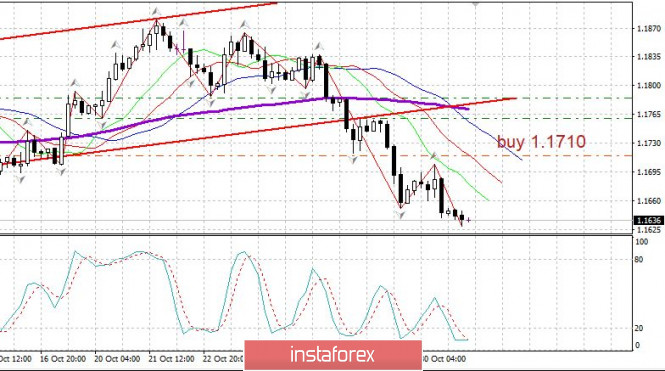
The technical picture of the EUR / USD pair today, November 2: There is a continuation of the downward trend, however, there are very strong resistances ahead - 100-day average and three-month low of 1.1612. As a result, a strong rebound upwards is possible. Open short positions from 1.1690. Open long positions from 1.1710. Technical Analysis of EUR/USD for November 2, 2020 2020-11-02 Technical Market Outlook: The EUR/USD pair keeps making lower lows and keeps trading in a descending channel. The last low was made at the level of 1.1629, but the target for bears is seen at the level of 1.1612. The momentum is weak and negative and the market conditions at the H4 time frame chart are extremely oversold, so please keep an eye on a temporary rebound. The nearest technical resistance is seen at the level of 1.1655 and 1.1695. Bears are in full control of the market and the weekly outlook is bearish. Weekly Pivot Points: WR3 - 1.1974 WR2 - 1.1916 WR1 - 1.1756 Weekly Pivot - 1.1698 WS1 - 1.1531 WS2 - 1.1471 WS3 - 1.1314 Trading Recommendations: Since the middle of March 2020 the main trend is on EUR/USD pair has been up, which can be confirmed by almost 10 weekly up candles on the weekly time frame chart and 4 monthly up candles on the monthly time frame chart. The recent correction towards the level of 1.1612 seems to be completed and now market is ready for another wave up. This means any local corrections should be used to buy the dips until the key technical support is broken. The key long-term technical support is seen at the level of 1.1445. The key long-term technical resistance is seen at the level of 1.2555. 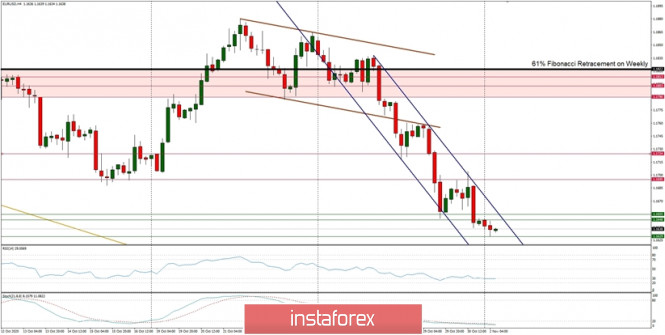
Technical Analysis of GBP/USD for November 2, 2020 2020-11-02 Technical Market Outlook: The GBP/USD pair keeps going lower in a descending channel. The last low was made at the level of 1.2893, which is at the short-term trend line support. Any violation of this level will indicate more bearish pressure that can push the prices to the level of 1.2868, 1.2848 or even 1.2816. The weak and negative momentum supports the short-term bearish outlook despite the oversold market conditions. Only a sustained breakout above the level of 1.2982 would change the intraday outlook to bullish. Weekly Pivot Points: WR3 - 1.3236 WR2 - 1.3153 WR1 - 1.3037 Weekly Pivot - 1.2956 WS1 - 1.2835 WS2 - 1.2757 WS3 - 1.2653 Trading Recommendations: The GBP/USD pair is in the down trend on the monthly time frame, but the recent bounce from the low at 1.1411 made in the middle of March 2020 looks very strong and might be a reversal swing. In order to confirm the trend change, the bulls have to break through the technical resistance seen at the level of 1.3518. All the local corrections should be used to enter a buy orders as long as the level of 1.2674 is not broken. 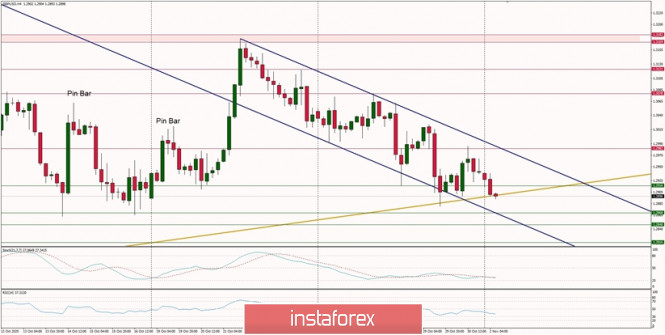
GBP/USD. November 2. COT report. The UK is under quarantine. There are still no results on negotiations on a trade agreement. 2020-11-02 GBP/USD – 1H. 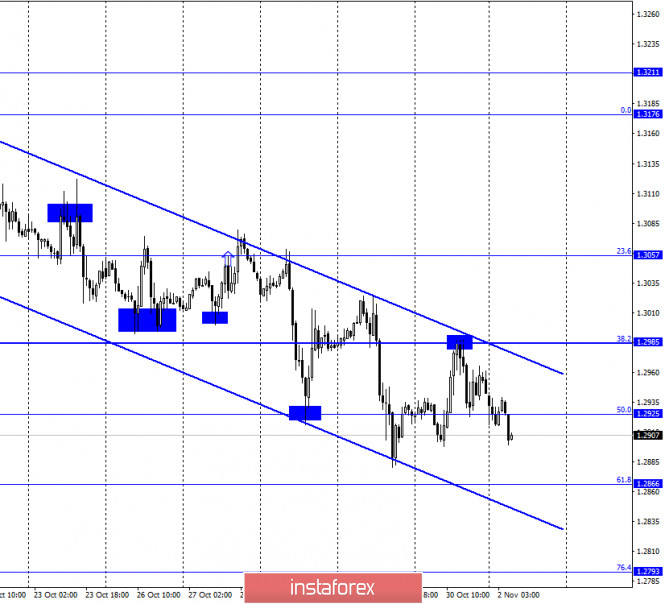
According to the hourly chart, the quotes of the GBP/USD pair performed a rebound from the corrective level of 38.2% (1.2985), a reversal in favor of the US currency, and resumed the process of falling in the direction of the corrective level of 61.8% (1.2866). The downward trend corridor continues to characterize the current mood of traders as "bearish". Meanwhile, in the UK, Prime Minister Boris Johnson announced the introduction of a four-week "hard" quarantine. Such measures were taken by the British government against the background of an emergency epidemiological situation in the UK. In recent days, almost 25 thousand new cases of coronavirus have been registered daily. To prevent further spread of the virus in the UK, all pubs, restaurants, and various entertainment facilities are being closed. All stores except grocery stores will also be closed. However, people are allowed to go to work, school, universities, medical institutions, as well as to walk in the fresh air and parks. Thus, the British government tried to preserve the working state of the economy as much as possible. Only the service sector will suffer, as it is the one that the quarantine measures concern. The British government has promised financial assistance to businesses and those who lost their jobs due to the new coronavirus outbreak. But no information was received on negotiations on a trade deal between the European Union and the UK. Although traders have been waiting for them for several days. Most likely, the negotiations are continuing and we will get their results in the near future. GBP/USD – 4H. 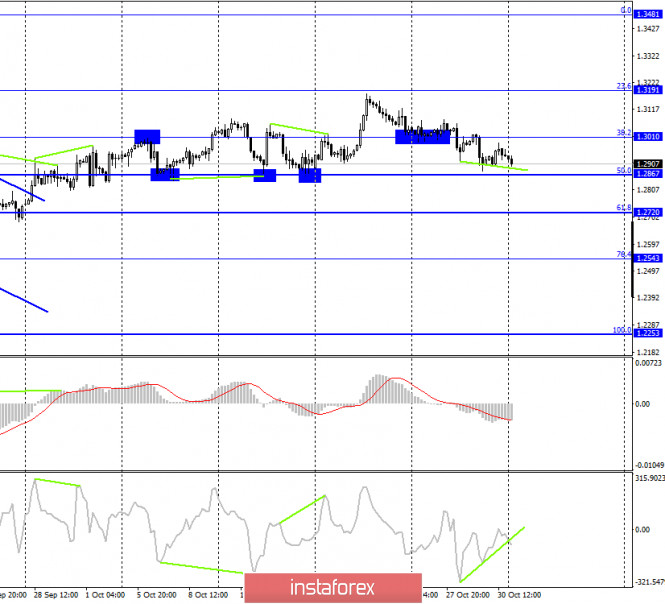
On the 4-hour chart, the GBP/USD pair continues to fall in the direction of the corrective level of 50.0% (1.2867). The CCI indicator continues to have a bullish divergence. A rebound of the pair's quotes from the Fibo level of 50.0% will work in favor of the British currency and the beginning of growth in the direction of the corrective level of 38.2% (1.3010), and may also coincide with the formation of a bullish divergence. Closing the pair's exchange rate below the 50.0% Fibo level will increase the probability of a further fall towards the next corrective level of 61.8% (1.2720). GBP/USD – Daily. 
On the daily chart, the pair's quotes have been fixed under the corrective level of 76.4% (1.3016), which now allows us to expect a fall in the direction of the next corrective level of 61.8% (1.2709). GBP/USD – Weekly. 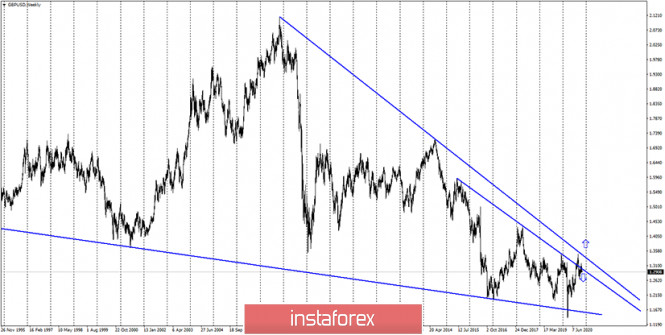
On the weekly chart, the pound/dollar pair closed under the lower downward trend line, thus, a false breakout of this line followed earlier. However, in recent weeks, the pair has made new attempts to gain a foothold over both trend lines. Overview of fundamentals: On Friday, the UK again did not have a single economic report. There was also still no official information about the progress of negotiations between the UK and the European Union. News calendar for the US and the UK: UK - PMI for the manufacturing sector (09:30 GMT). US - ISM manufacturing index (15:00 GMT). On November 2, the UK news calendar contains only the PMI index for the manufacturing sector, while the US news calendar contains a similar index. It is unlikely that these two reports will cause a serious market reaction. COT (Commitments of Traders) report: 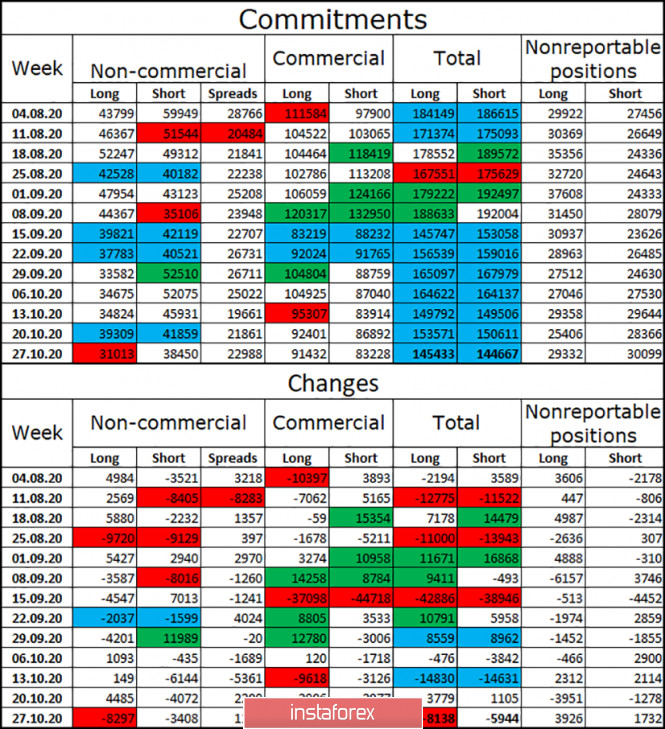
The latest COT report on the British pound showed that the mood of the "Non-commercial" category of traders became more "bearish" over the reporting week. Speculators got rid of 8,297 long contracts and 3,408 short contracts. Thus, in general, speculators got rid of any contracts for the British. However, it is mostly from long-contracts. This suggests that the major players do not believe in the pound. It is extremely difficult to do this in the current conditions, as the prospects for the British economy remain extremely vague. Since August, the total number of long contracts in the hands of speculators has decreased to an absolute minimum – only 31,013. The total number of open contracts among all categories of traders has been almost the same for two months. Forecast for GBP/USD and recommendations for traders: Today, I recommend keeping open sales of the GBP/USD pair with a target of 1.2867, and opening new sales when this level is overcome with a target of 1.2793. I recommend buying the British dollar with a target of 1.3010 if the rebound from the level of 50.0% (1.2867) on the 4-hour chart is completed. Terms: "Non-commercial" - major market players: banks, hedge funds, investment funds, private, large investors. "Commercial" - commercial enterprises, firms, banks, corporations, companies that buy currency not for speculative profit, but for current activities or export-import operations. "Non-reportable positions" - small traders who do not have a significant impact on the price. EUR/USD. November 2. COT report. The European currency continues to fall on the background of statements by Christine Lagarde and a "hard" quarantine in Europe. 2020-11-02 EUR/USD – 1H. 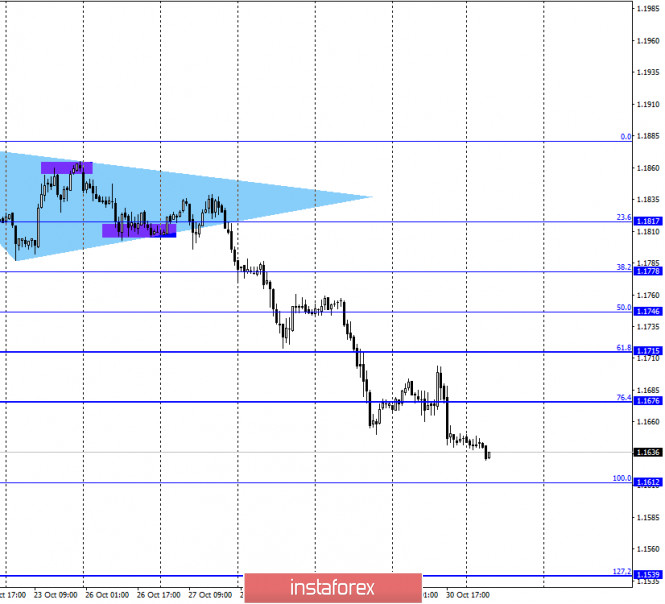
On October 30, the EUR/USD pair performed a new consolidation under the corrective level of 76.4% (1.1676) and resumed the process of falling in the direction of the corrective level of 100.0% (1.1612). The rebound of quotes from this level will allow traders to count on a reversal in favor of the EU currency and some growth in the direction of 1.1676. Closing the pair's exchange rate under the 100.0% Fibo level will increase the chances of a further fall towards the next corrective level of 127.2% (1.1539). The euro currency, meanwhile, continues to fall despite the upcoming presidential elections in the United States (in fact, tomorrow). That is, the dollar is getting more expensive. Bear traders who haven't shown much desire to trade in the past three months abruptly started opening new sell orders a week before the election. So I can't say that traders are afraid of the election or its consequences. Most likely, the reason lies in the European Union. First of all, last week there was a speech by Christine Lagarde, who was very pessimistic. Secondly, the EU countries have started to close for "lockdowns", and this means an inevitable new contraction of the economy. Third, there are indeed high levels of disease in the European Union, and it is still unclear when it will be possible to cope with the COVID virus. After all, the coldest time of the year is still ahead. Thus, traders can get rid of the European currency in recent days. However, what will happen tomorrow or the day after tomorrow with the US dollar? EUR/USD – 4H. 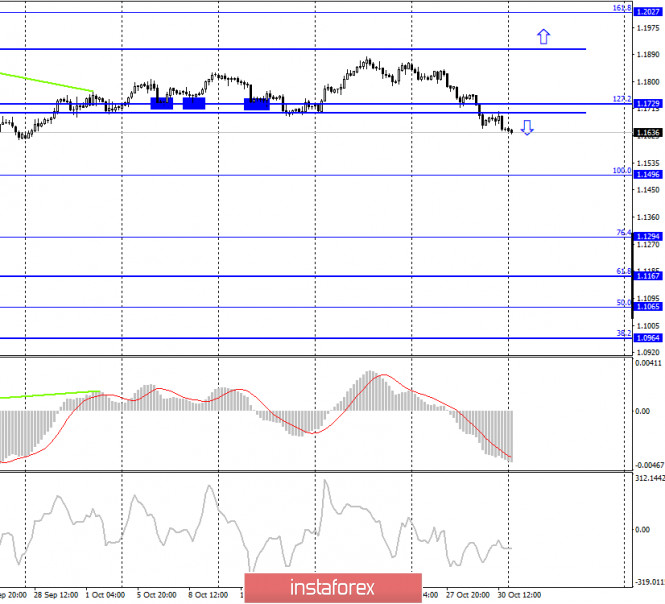
On the 4-hour chart, the pair's quotes were fixed under the side corridor. Thus, the probability of a further fall in the direction of the corrective level of 100.0% (1.1496) increased. The lower chart also supports this scenario. I recommend paying more attention to the lower chart, since the 4-hour corrective levels are located quite far from each other. EUR/USD – Daily. 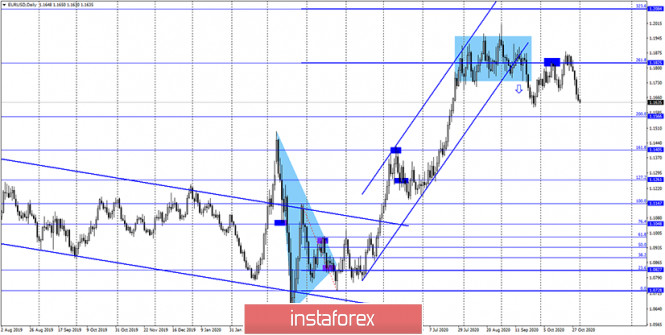
On the daily chart, the EUR/USD pair quotes performed a new rebound from the corrective level of 261.8% (1.1825), after which the quotes continue to fall in the direction of the Fibo level of 200.0% (1.1566). Closing the pair's exchange rate below this level will work in favor of a further drop in quotes towards the level of 161.8% (1.1405). EUR/USD – Weekly. 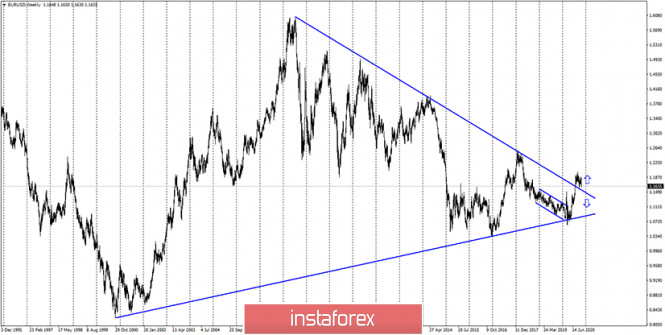
On the weekly chart, the EUR/USD pair performed a consolidation above the "narrowing triangle", which preserves the prospects for further growth of the pair, but in the long term. In the short term, a drop is preferable. Overview of fundamentals: On October 30, the European Union released a report on GDP for the third quarter, which showed an increase greater than expected by traders, 12.7% q/q. However, the unemployment rate also increased, to 8.3%, and the consumer price index remained at an unprecedented low level, -0.3% y/y. News calendar for the United States and the European Union: EU - index of business activity in the manufacturing sector (09:00 GMT). US - ISM manufacturing index (15:00 GMT). On November 2, the US and the European Union will release indices of business activity in the manufacturing sectors. However, this information may not be very interesting for traders. Now there are many more important events and news. COT (Commitments of Traders) report: 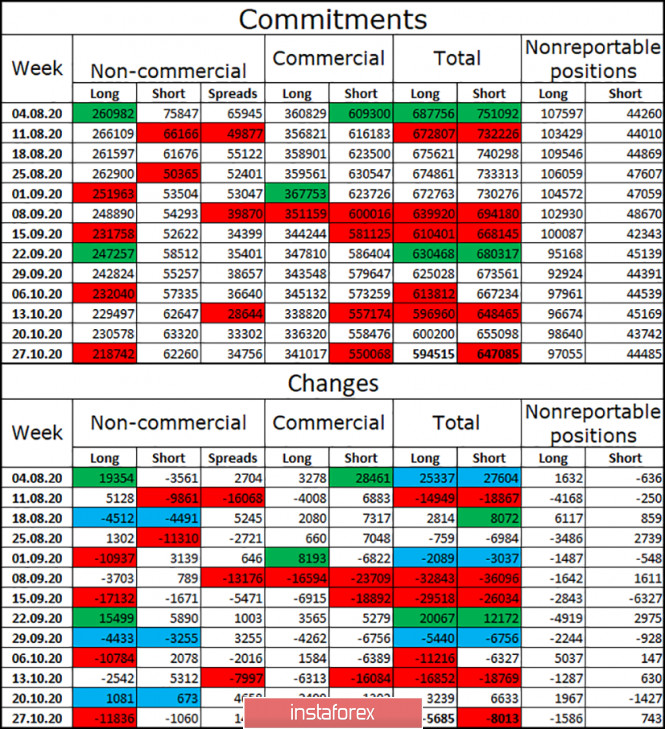
The latest COT report was quite informative. The most important category of non-commercial traders got rid of 12 thousand long contracts and 1 thousand short contracts during the reporting week. Thus, speculators do not believe in the further growth of the European currency and get rid of more purchases of this currency. This process, I must say, has been going on for several weeks, so a trend is emerging. Over the past two months, the total number of long contracts in the hands of speculators has been steadily falling, while the number of short contracts has been growing slightly. Thus, I am inclined to the option with a further fall in the euro currency quotes. Forecast for EUR/USD and recommendations for traders: Today, I recommend keeping open sales of the euro currency with a target of 1.1612. And if there is a close below this level, then the target is the Fibo level of 127.2% (1.1539). Purchases of the pair will be possible with a target of 1.1676 if the quotes perform a rebound from the level of 100.0% on the hourly chart. Terms: "Non-commercial" - major market players: banks, hedge funds, investment funds, private, large investors. "Commercial" - commercial enterprises, firms, banks, corporations, companies that buy currency not for speculative profit, but for current activities or export-import operations. "Non-reportable positions" - small traders who do not have a significant impact on the price. Technical analysis of EUR/USD pair for this week (Nov 2-7, 2020) 2020-11-02 Trend analysis The price from the level of 1.1647 (closing of the last weekly candle) may continue to decline this week, with the first goal at 1.1612 - the lower fractal (white bold line). After testing this level, we can trade upwards with the goal of 1.1669 – a pullback level of 14.6% (blue dotted line). If this level is reached, further rise can be expected. 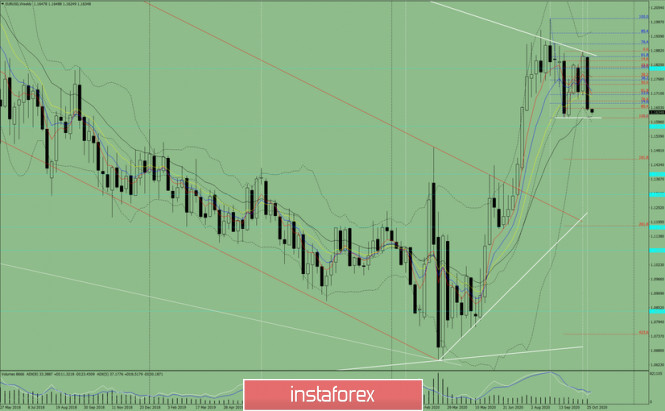
Figure 1: Weekly chart Comprehensive analysis: - indicator analysis - up; - Fibonacci levels - up; - volumes - up; - candlestick analysis - down; - trend analysis - up; - Bollinger lines - up; - monthly chart - up. An increase in the pair can be concluded based on the comprehensive analysis. The overall result of calculating the EUR/USD currency pair candle on a weekly chart: the price is likely to have an upward trend this week with the lower shadow of the weekly white candle (Monday - down) and the upper shadow (Friday - down). The first downward goal is at 1.1612 - the lower fractal (white bold line). After testing this level, we can trade upwards with the goal of 1.1669 – a pullback level of 14.6% (blue dotted line). Upon reaching this level, further rise can be expected. An unlikely scenario: a decline from the level of 1.1647 (closing of the last weekly candle), with a goal at 1.1612 - a lower fractal (white bold line) and moving further below towards the goal of 1.1578 - the historical support level (blue dotted line) is unlikely. Simplified wave analysis and forecast for EUR/USD, AUD/USD, and GBP/JPY on November 2 2020-11-02 EUR/USD Analysis: The dominant rising wave of the pan-European currency since March 20 has been forming a correction phase (B) since the end of July. The wave develops mainly in the side plane. Its structure looks complete. The price is at the lower edge of a wide potential reversal zone of the daily scale. Forecast: Today, the price is expected to move in the corridor between the opposite zones. After an attempt to put pressure on the support zone in the European session, there is a high probability of a change in the exchange rate and price growth. Potential reversal zones Resistance: - 1.1690/1.1720 Support: - 1.1620/1.1590 Recommendations: the The euro is of interest to supporters of intraday trading today. It is more reasonable to conduct trade transactions from the calculated borders, according to the expected sequence. 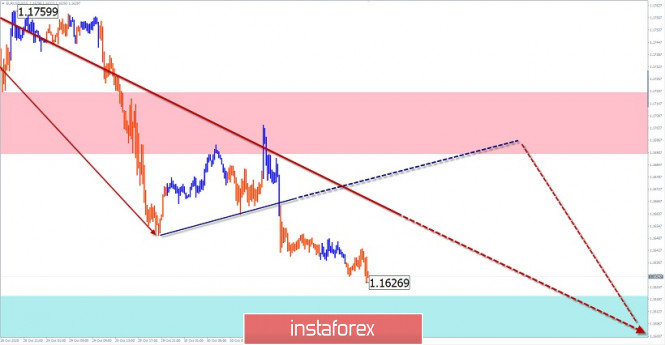
AUD/USD Analysis: The upward wave of the Australian dollar from September 25 forms the beginning of the final part of a more global bullish trend. In its structure, the entire past month was formed by collection (B), which is not yet completed until now. The movement has entered its final phase. Forecast: The current price movement vector is expected to continue in the next 24 hours. In the European session, a short-term rise in the area of the resistance zone is possible. The active decline is more likely in the second half of the day. Potential reversal zones Resistance: - 0.7020/0.7050 Support: - 0.6950/0.6920 Recommendations: There are no conditions for "Aussie" purchases today. In the area of resistance, it is recommended to track reversal signals for selling the instrument. 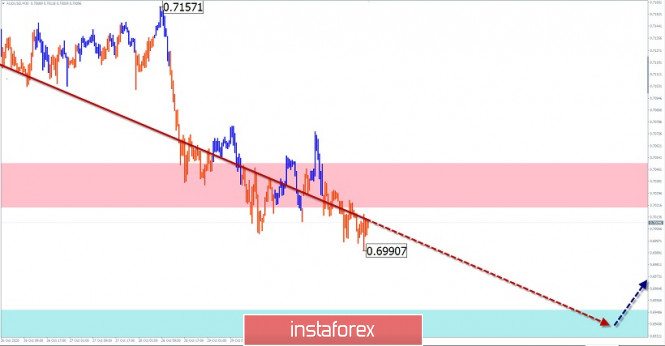
GBP/JPY Analysis: The last short-term wave of the pound cross against the yen started on October 12. Its direction coincides with the course of a larger bearish structure. Since last week, the price forms a hidden correction of the wrong type. Forecast: In the next trading sessions, the pair will see a general flat mood of the movement. After the probable pressure on the resistance zone, the exchange rate is expected to change and decrease to the lower border of the price corridor. Potential reversal zones Resistance: - 135.70/136.00 Support: - 134.60/134.30 Recommendations: Trading on the pair's market today is only possible within the session. You should be careful when purchasing. After the appearance of reversal signals in the resistance area, priority should be given to sales. 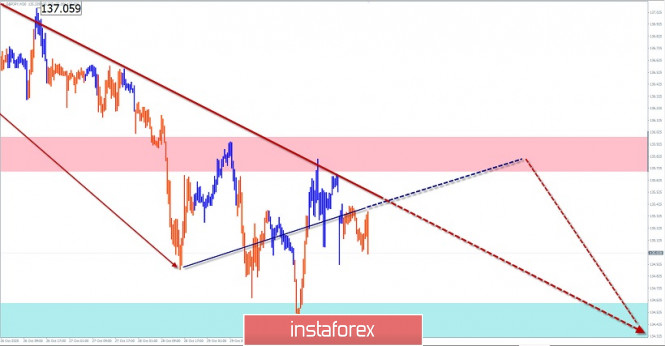
Explanation: In the simplified wave analysis (UVA), waves consist of 3 parts (A-B-C). The last incomplete wave is analyzed. The solid background of the arrows shows the formed structure, and the dotted background shows the expected movements. Note: The wave algorithm does not take into account the duration of the instrument's movements in time! AUD/USD. An ambitious greenback crushes the aussie ahead of the RBA meeting 2020-11-02 The bears of the AUD/USD pair tried to push through the most important support level of 0.7000. Any victorious successes on the coronavirus front of Australia did not help the aussie, nor did positive macroeconomic reports from China. Traders virtually ignored all these factors - the pair continues to drift at the bottom of the 70th figure. Take note that the bearish sentiment is not only due to the rise in the US dollar index. Market participants are nervous ahead of the November meeting of the Reserve Bank of Australia, which will take place tomorrow. On the eve of this event, discussions among experts resumed regarding possible actions of the central bank. The baseline scenario is a 15 basis point cut in the interest rate to 0.1%. An alternative (most pessimistic) scenario is to reduce the rate to the zero level (that is, by 25 points) with a simultaneous expansion of the incentive program. Given the ongoing intrigue, the aussie is under pressure. Moreover, against the backdrop of the US dollar's rally, which is used as the main protective instrument.  The greenback continues to gradually gain momentum, amid the second wave of the coronavirus pandemic in Europe and the tightening of quarantine restrictions in key EU countries. Also, we must not forget about the US presidential elections, which will take place tomorrow, November 3. It is difficult to say which factors play a dominant role, but, by and large, this is not so important. Traders are worried that the second wave of the pandemic will hit the pace of global economic recovery. A partial lockdown was announced in France, Germany, Czech Republic, Greece and Austria and Portugal. Quarantine restrictions have also been significantly tightened in the rest of the EU (primarily in Spain, Italy, Poland), despite protests. And although the current lockdowns are not as strict as this spring, they will certainly hit the most vulnerable sectors of the economy (restaurant business, tourism, air travel, and so on). Against this background, the dollar started to be in demand as a protective asset again. The US presidential election only adds to the nervousness. Joe Biden is ahead of President Donald Trump nationally, according to polls released yesterday. However, the Republican remains hopeful of victory thanks to the high odds in the faltering states. Trump remains close to Biden in enough states to win the 270 electoral votes needed for re-election to a second term. Reuters polls show candidates head to head in Florida, North Carolina and Arizona. Let me remind you that key states helped Trump win the Electoral College in 2016, although Hillary Clinton won the popular vote. Such is the specificity of the American electoral system. Given the ongoing intrigue, and also against the backdrop of a possible political crisis (if Trump does not admit his loss), the US dollar is in high demand as a protective asset once again. But the Australian dollar continues to lose its positions ahead of the November meeting of the RBA. The likelihood of monetary policy easing is 100%, but there is ongoing discussion among experts about how large-scale the central bank's steps will be. So, back in mid-October, RBA Governor Philip Lowe warned that the rate could soon be reduced to 0.1%. This is the most likely scenario. However, the minutes of the RBA October meeting, published the week before last, showed that the members of the regulator do not exclude a rate cut to zero. In addition, according to a number of analysts, the central bank will also expand QE by 100 billion Australian dollars. Take note that just last week, RBA spokesman Christopher Kent, said that "he would not be surprised by a drop in short-term rates below zero." But in my opinion, such a scenario is too unlikely to be considered among the main ones. Nevertheless, the intrigue of the November meeting remains. If the RBA cuts the rate to 0.1%, then the aussie's reaction will depend on the subsequent rhetoric of the head of the RBA. The Australian dollar may show a correctional growth if Lowe declares that he will maintain a wait-and-see position for the foreseeable future, since the very fact of the rate cut has already been taken into account in prices. If he announces further steps to ease monetary policy, the aussie will remain under significant pressure. And even more so - if the rate is nevertheless reduced to zero. In this case, the AUD/USD bears will finally settle in the area of the 69th figure and open their way to the 0.6850 support level - this is the lower line of the Bollinger Bands indicator on the weekly chart. Take note that the aussie has ignored the positive signals of the fundamental background. Firstly, it ignored the fact that Australia "defeated COVID-19": not a single case of coronavirus infection has been registered in the country for the second day. Curfews were lifted and quarantine restrictions were eased in Melbourne, and quarantine was almost completely canceled in all other cities and states. Secondly, the aussie ignored today's statistics from China: the PMI index for the manufacturing sector from Markit came out in the green zone (53.6 points), having updated this year's high. The market ignored all these fundamental factors. 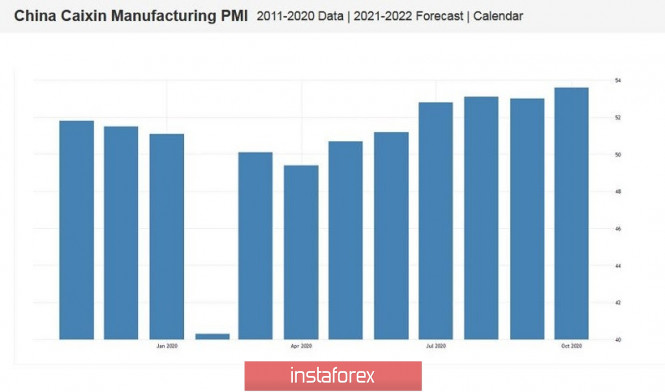 Thus, the bears are now storming AUD/USD's key support level of 0.7000, impulsively looking into the 69th figure. You can open short positions, but only if sellers settle below 0.7000 - otherwise there is a risk of a large-scale corrective pullback. Trading decisions on the pair should be made based on the results of tomorrow's RBA meeting, which can either aggravate the situation for the aussie, or lend a helping hand to the Australian dollar, keeping it above the support level. Analysis and forecast for EUR/USD on November 2, 2020 2020-11-02 In today's article, we will summarize the results of October trading, the last trading week, and also try to determine the prospects for the price movement of the main currency pair of the Forex market. Monthly 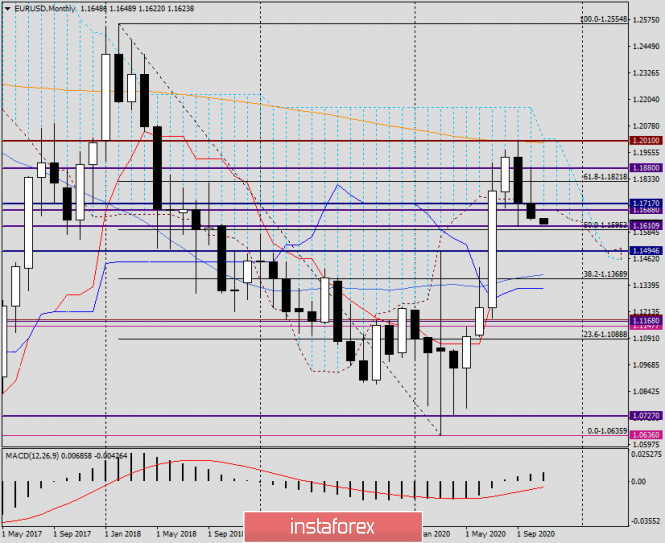
Since the market closed October trading last Friday, let's look at the monthly chart. Usually, this timeframe is considered after the end of the next month. Thus, as can be seen on this chart, the EUR/USD pair made a deep correction to the level of 61.8 Fibo from the global decline of 1.2555-1.0636. As a rule, the classic course correction reaches the level of 50.0 Fibo from a particular movement, after which the price reverses towards the main trend. However, it also happens that there is a deeper correction to 61.8 Fibo, but if the rate is fixed above this level, we can safely assume that there has been a trend change. In the situation of the euro/dollar, there were attempts to gain a foothold above 61.8 Fibo from the decline of 1.2555-1.0626, however, they were unsuccessful. After closing August above 61.8 Fibo, in September, the euro bulls tried to build on their success and continue the rate rise. However, after meeting strong resistance from sellers near the iconic psychological and technical level of 1.2000, they gave control of the pair to their opponents. I believe that, in addition to the key mark of 1.2000, the orange 200 exponential moving average played a significant role as a serious resistance, which contributed to the stop of the rise and the reversal of the euro/dollar in the south direction. At the October auction, the euro bulls became active again and tried their luck again. At first, everything was fine for them. The pair showed strengthening. However, the arrival of the second wave of the COVID-19 pandemic, first in Europe and then in the United States, significantly increased the demand for the US dollar as a safe asset. From a technical point of view, it can be stated that the euro bulls failed to overcome a sufficiently strong technical zone of 1.1840-1.1880, which this time acted as a resistance. If we sum up the results of October trading, the inability of the main currency pair to resume the upward dynamics and the price coming down from the Ichimoku indicator cloud promises further downward prospects for the euro/dollar. Weekly 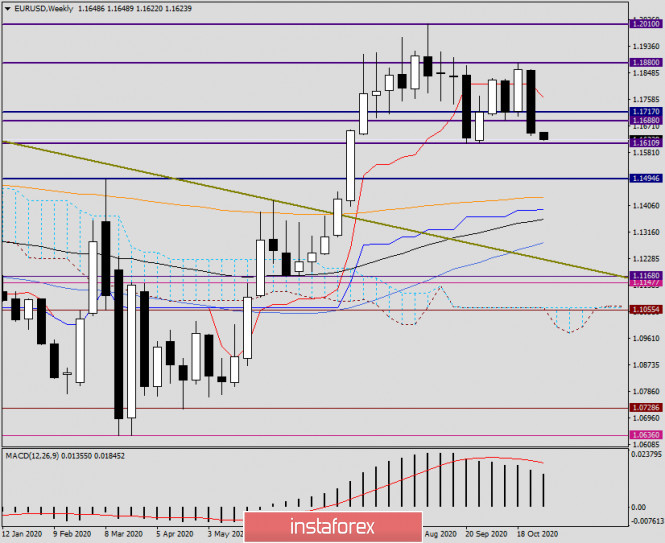
At the end of last week, the euro of all major currencies showed the largest decline against the US dollar, which was 1.75%. As a result of a rather impressive fall, the pair fell under the red Tenkan line of the Ichimoku indicator, and after an increased downward momentum, support fell at 1.1717 and 1.1688, and an important technical level of 1.1700 was broken, near which there was a strong support zone for a long time. And now, finally, it is broken. Trading in the current five-day period began for EUR/USD as a continuation of the direction that the quote showed earlier. At the end of the article, the main currency pair is slightly reduced, and trading is conducted near 1.1630. If the downward trend continues right now, the nearest target will be a strong support level of 1.1611. H1 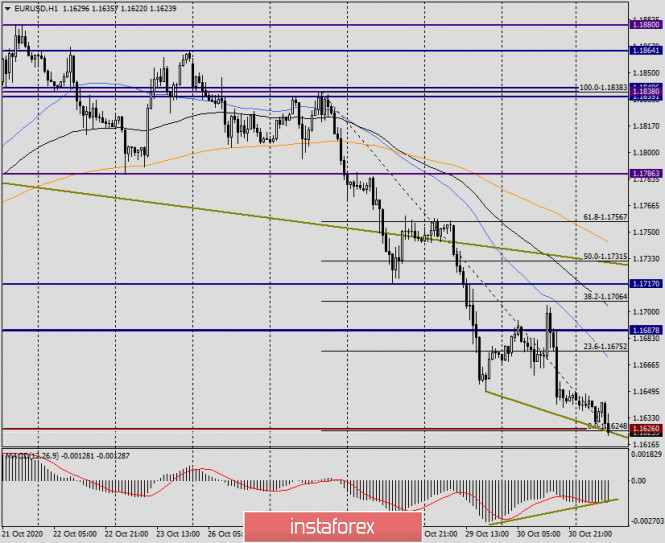
If you go to the trading recommendations, then you need to choose a smaller period. I stopped at the hourly chart, where I stretched the grid of the Fibonacci tool to a decrease of 1.1830-1.1625. Given the previous rather strong decline and the bullish divergence of the MACD indicator, I recommend waiting for a corrective pullback to the price zone of 1.1670-1.1675 and consider selling the euro/dollar from there, which is the main trading idea for this instrument. If there is no pullback now, it may start from a strong support area of 1.1615-1.1600. In any case, to sell at the very bottom of the market without waiting for a corrective pullback is quite risky. As for possible purchases, I recommend that you refrain from them for the time being, since they are against the current bearish trend, and there are no clear signals for opening long positions yet. In conclusion, let me remind you about the main events of the week that started, which will be the presidential elections in the United States of America and data on the US labor market. We will talk about these and other events in more detail in the following articles on the main currency pair of the Forex market. With a high degree of probability, we can assume that trading in the euro/dollar this week will be quite volatile. Technical analysis of EUR/USD for November 02, 2020 2020-11-02  Overview : The EUR/USD pair fell from the top of 1.1860 to the bottom of 1.1640 without any rebound or rebound last week. It should be noted that the Euro lost 220 pips and the trend was significantly down. Indeed, the Euro currency lost control and moved below the 1.1790 level since last week, so the bears will restore control of the performance. Therefore we are on a date with support levels before any rebound or rebound. This week, we expect to continue the drop from the low of 1.1640 to the first support at 1.1572. But it should be careful in the area of 1.1500 - 1.1572. This week will be full of strong news such as: fiery events in the US elections 2020 as well as US interest and US monthly data on jobs, wages and unemployment. We see that selling from the bottom 1.1640 will be safer, aiming to continue the drop to the first target 1.1572. The Relative Strength Index (RSI) knows clear saturation at the 30th line, so we confirm that the pair has declined in the few hours. On the other hand, the 1.1572 and 1.1500 areas are strong pillars of the rebound, thus excluding a breach of the 1.1500 level this week. If the EUR / USD pair knows a bounce from the above-mentioned areas, profit taking will be very beneficial at 1.1572 (support 1). Hence, the recovery of the euro from the spot of 1.1572 and 1.1500 is very likely, especially in the case of a breach of the pivot point 1.1716 (leftist blue line). So, buying will be positive above the levels 1.1572 and 1.1716 this week to reach the resistance 1.1972 and then return to 1.1572 and 1.1716 this week to reach the 1.1972 resistance. And then return to (1.1572 and 1.1716). The expected weekly range from November 2 to November 6 is between 1.1572 and 1.1792. EUR/USD: What could help the euro rise during this challenging time? 2020-11-02 All efforts that were made these previous months to ensure that the economy would recover may end up in vain, especially now that the euro region has again implemented quarantine restrictions to curb the returning coronavirus pandemic.  In fact, the eurozone economy has grown much better than expected this 3rd quarter, even surpassing that of the US economy. According to some experts, this is maybe due to what we call "the rebound effect", since the bloc faced a stronger decline than the United States in the second quarter. Now, given the fact that many European countries have brought back restrictions to stop the further spread of the coronavirus, the prospects for the 4th quarter have taken a different direction. If in the 3rd quarter, the EU's GDP grew by 12.7%, a strong decline is expected to occur in the 4th quarter, mainly because of the serious threat the restrictions pose on the service and manufacturing industries. 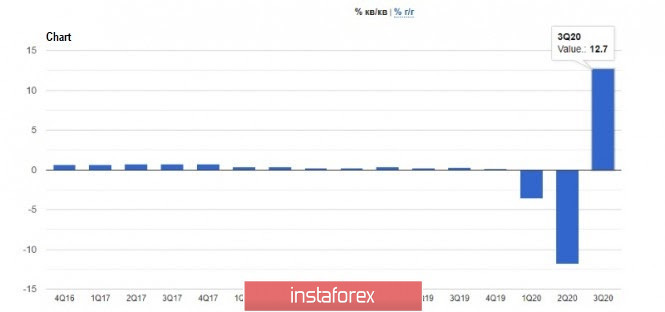 For example, Germany's GDP in the 3rd quarter increased by 8.2% compared to the 2nd quarter. But now that the country has implemented new restrictive measures, it will be impossible to see such growth rates again in the 4th quarter. So far, these new restrictions are bypassing industries, and today's data on economic activity will prove this. A one-month closure will not give serious damage (especially since the government promised a maximum support on businesses), however, a long-term implementation will become a serious problem for the entire economy. Another case is Italy's economy during the pandemic, which contracted sharply as well in the 2nd quarter, but rebounded strongly in the 3rd quarter. According to a report, Italy's GDP grew by 16.1% in Q3, while economists had expected it to grow by only 10.6%. As for the revised data, Italy's GDP dropped by 13% in Q2, not by 12.4% as previously thought. Compared to the same period last year, Italy's economy contracted by 4.7%, not 10.2%, as predicted by economists. With regards to the United States, all focus is on the presidential elections, on which a lot depends. Joe Biden's victory could turn everything around, but the problems with the coronavirus pandemic remain a priority. In addition, the slowdown in the Chicago PMI does not pose a serious threat yet, but nonetheless is the first call for the economy. According to the MNI Indicators, the index fell from 62.4 points to 61.1 points in October, while economists had expected the index to be 57.9 points. As for the consumer sentiment index, an increase was observed, as indicated by the report released by University of Michigan. According to data, the index rose from 80.4 points to 81.8 points in October, while economists had expected a value of only 81.2 points. Unfortunately, some experts say that the lack of fear among the respondents could have created a deceptive sense of stability in consumer sentiment, especially since the consumer expectations index rose from 75.5 to 79.2 despite the current stubborn rise of the coronavirus in the country.  Nonetheless, personal incomes of Americans have increased, which will positively affect the economy in the 4th quarter of this year. According to the data, revenues rose 0.9% in September this year, along which household spending jumped more significantly. It rose 1.4% in September, while economists had forecasted an increase of only 1%. With all these, the technical picture of the EUR/USD pair indicates that the market completely ignores the oversold euro and continues to decline against the background of lack of activity from new investors, which is reflected in the COT reports submitted to the CME. As shown by the data on October 27, there was a reduction in both long and short positions. Long non-commercial positions fell to 217,443, while short non-commercial positions fell to 61,888. The total non-commercial net position fell to 155,555 from 165,943 a week earlier. All this speaks of a real cautious approach to risks and a lack of desire to build up long positions, which will keep the pressure on the euro in the near future. Thus, bears will seek to break the support at 1.1615, which will make it easier to reach the levels 1.1580 and 1.1540. Sales will increase on the grounds of weak data on activity in the manufacturing sector of the eurozone, but if Joe Biden wins the US elections, demand for the dollar will significantly decrease, which will help the European currency regain its position. A return above the level of 1.1650 will make it easier to reach the 17th figure, a breakout of which will lead to price levels 1.1760 and 1.1835.
Author's today's articles: Maxim Magdalinin  In 2005 graduated from the Academy of the Ministry of Internal Affairs of the Republic of Belarus, law faculty. Worked as a lawyer for three years in one of the biggest country's company. Besides the trading, he develops trading systems, writes articles and analytical reviews. Works at stock and commodity markets explorations. On Forex since 2006. In 2005 graduated from the Academy of the Ministry of Internal Affairs of the Republic of Belarus, law faculty. Worked as a lawyer for three years in one of the biggest country's company. Besides the trading, he develops trading systems, writes articles and analytical reviews. Works at stock and commodity markets explorations. On Forex since 2006. Sergey Belyaev  Born December 1, 1955. In 1993 graduated from Air Force Engineering Academy. In September 1999 started to study Forex markets. Since 2002 has been reading lectures on the technical analysis . Is fond of research work. Created a personal trading system based on the indicator analysis. Authored the book on technical analysis "Calculation of the next candlestick". At present the next book is being prepared for publishing "Indicator Analysis of Forex Market. Trading System Encyclopedia". Has created eleven courses on indicator analysis. Uses classical indicators. Works as a public lecturer. Held numerous seminars and workshops presented at international exhibitions of financial markets industry. Is known as one of the best specialists in the Russian Federation researching indicator analysis. Born December 1, 1955. In 1993 graduated from Air Force Engineering Academy. In September 1999 started to study Forex markets. Since 2002 has been reading lectures on the technical analysis . Is fond of research work. Created a personal trading system based on the indicator analysis. Authored the book on technical analysis "Calculation of the next candlestick". At present the next book is being prepared for publishing "Indicator Analysis of Forex Market. Trading System Encyclopedia". Has created eleven courses on indicator analysis. Uses classical indicators. Works as a public lecturer. Held numerous seminars and workshops presented at international exhibitions of financial markets industry. Is known as one of the best specialists in the Russian Federation researching indicator analysis. Vladislav Tukhmenev  Vladislav graduated from Moscow State University of Technologiy and Management. He entered the forex market in early 2008. Vladislav is a professional trader, analyst, and manager. He applies a whole gamut of analysis – technical, graphical, mathematical, fundamental, and candlestick analysis. Moreover, he forecasts the market movements using his own methods based on the chaos theory. Vladimir took part in development of trading systems devoted to fractal analysis. In his free time, Vladimir blogs about exchange markets. Hobbies: active leisure, sporting shooting, cars, design, and marketing. "I do not dream only of becoming the best in my field. I also dream about those who I will take with me along the way up." Vladislav graduated from Moscow State University of Technologiy and Management. He entered the forex market in early 2008. Vladislav is a professional trader, analyst, and manager. He applies a whole gamut of analysis – technical, graphical, mathematical, fundamental, and candlestick analysis. Moreover, he forecasts the market movements using his own methods based on the chaos theory. Vladimir took part in development of trading systems devoted to fractal analysis. In his free time, Vladimir blogs about exchange markets. Hobbies: active leisure, sporting shooting, cars, design, and marketing. "I do not dream only of becoming the best in my field. I also dream about those who I will take with me along the way up." Mihail Makarov  - - Sebastian Seliga  Sebastian Seliga was born on 13th Oсtober 1978 in Poland. He graduated in 2005 with MA in Social Psychology. He has worked for leading financial companies in Poland where he actively traded on NYSE, AMEX and NASDAQ exchanges. Sebastian started Forex trading in 2009 and mastered Elliott Wave Principle approach to the markets by developing and implementing his own trading strategies of Forex analysis. Since 2012, he has been writing analitical reviews based on EWP for blogs and for Forex websites and forums. He has developed several on-line projects devoted to Forex trading and investments. He is interested in slow cooking, stand-up comedy, guitar playing, reading and swimming. "Every battle is won before it is ever fought", Sun Tzu Sebastian Seliga was born on 13th Oсtober 1978 in Poland. He graduated in 2005 with MA in Social Psychology. He has worked for leading financial companies in Poland where he actively traded on NYSE, AMEX and NASDAQ exchanges. Sebastian started Forex trading in 2009 and mastered Elliott Wave Principle approach to the markets by developing and implementing his own trading strategies of Forex analysis. Since 2012, he has been writing analitical reviews based on EWP for blogs and for Forex websites and forums. He has developed several on-line projects devoted to Forex trading and investments. He is interested in slow cooking, stand-up comedy, guitar playing, reading and swimming. "Every battle is won before it is ever fought", Sun Tzu Grigory Sokolov  Born 1 January, 1986. In 2008 graduated from Kiev Institute of Business and Technology with "Finance and Credit" as a major. Since 2008 has studied the behavior of various currency pairs and their correlation on Forex. In his works and trading practice he uses candlestick analysis and Fibonacci technique. Since 2009 has written analytical reviews and articles which are published on popular Internet resources. Interests: music, computers and cookery. "Out of five deadly sins of business and as a rule, the most widespread, excessive striving to get profit is the worst". P. Drucker Born 1 January, 1986. In 2008 graduated from Kiev Institute of Business and Technology with "Finance and Credit" as a major. Since 2008 has studied the behavior of various currency pairs and their correlation on Forex. In his works and trading practice he uses candlestick analysis and Fibonacci technique. Since 2009 has written analytical reviews and articles which are published on popular Internet resources. Interests: music, computers and cookery. "Out of five deadly sins of business and as a rule, the most widespread, excessive striving to get profit is the worst". P. Drucker Vyacheslav Ognev  Vyacheslav was born on August 24, 1971. In 1993, he graduated from Urals State University of Economics in the Russian city of Ekaterinburg holding a degree in Commerce and Economics of Trade. In 2007, he started concentrating on the Russian stock market, trading stocks on the RTS Stock Exchange and futures contracts on FORTS. Since 2008 he has been engaged in analyzing Forex market and trading currencies. He is an author of a simplified wave analysis method. He has also developed a trading strategy. At present, Vyacheslav is a co-author of training materials on two web portals dedicated to Forex trading education. Interests: fitness, F1 "Experience is the best of schoolmasters, only the school fees are heavy." - Thomas Carlyle Vyacheslav was born on August 24, 1971. In 1993, he graduated from Urals State University of Economics in the Russian city of Ekaterinburg holding a degree in Commerce and Economics of Trade. In 2007, he started concentrating on the Russian stock market, trading stocks on the RTS Stock Exchange and futures contracts on FORTS. Since 2008 he has been engaged in analyzing Forex market and trading currencies. He is an author of a simplified wave analysis method. He has also developed a trading strategy. At present, Vyacheslav is a co-author of training materials on two web portals dedicated to Forex trading education. Interests: fitness, F1 "Experience is the best of schoolmasters, only the school fees are heavy." - Thomas Carlyle Irina Manzenko  Irina Manzenko Irina Manzenko Ivan Aleksandrov  Ivan Aleksandrov Ivan Aleksandrov Mourad El Keddani  Was born in Oujda, Morocco. Currently lives in Belgium. In 2003 obtained B.S. in Experimental Sciences. In 2007 obtained a graduate diploma at Institut Marocain Specialise en Informatique Applique (IMSIA), specialty – Software Engineering Analyst. In 2007–2009 worked as teacher of computer services and trainer in a professional school specializing in computer technologies and accounting. In 2005 started Forex trading. Authored articles and analytical reviews on Forex market on Forex websites and forums. Since 2008 performs Forex market research, and develops and implements his own trading strategies of Forex analysis (especially in Forex Research & Analysis, Currency Forecast, and Recommendations and Analysis) that lies in: Numerical analysis: Probabilities, equations and techniques of applying Fibonacci levels. Classical analysis: Breakout strategy and trend indicators. Uses obtained skills to manage traders' accounts since 2009. In April 2009 was certified Financial Technician by the International Federation of Technical Analysts. Winner of several social work awards: Education Literacy and Non-Formal Education (in Literacy and Adult Education in The National Initiative for Human Development). Was born in Oujda, Morocco. Currently lives in Belgium. In 2003 obtained B.S. in Experimental Sciences. In 2007 obtained a graduate diploma at Institut Marocain Specialise en Informatique Applique (IMSIA), specialty – Software Engineering Analyst. In 2007–2009 worked as teacher of computer services and trainer in a professional school specializing in computer technologies and accounting. In 2005 started Forex trading. Authored articles and analytical reviews on Forex market on Forex websites and forums. Since 2008 performs Forex market research, and develops and implements his own trading strategies of Forex analysis (especially in Forex Research & Analysis, Currency Forecast, and Recommendations and Analysis) that lies in: Numerical analysis: Probabilities, equations and techniques of applying Fibonacci levels. Classical analysis: Breakout strategy and trend indicators. Uses obtained skills to manage traders' accounts since 2009. In April 2009 was certified Financial Technician by the International Federation of Technical Analysts. Winner of several social work awards: Education Literacy and Non-Formal Education (in Literacy and Adult Education in The National Initiative for Human Development).
Languages: Arabic, English, French and Dutch.
Interests: Algorithm, Graphics, Social work, Psychology and Philosophy. Pavel Vlasov  No data No data
Subscription's options management Theme's:
Fundamental analysis, Fractal analysis, Wave analysis, Technical analysis, Stock Markets
Author's :
A Zotova, Aleksey Almazov, Alexander Dneprovskiy, Alexandr Davidov, Alexandros Yfantis, Andrey Shevchenko, Arief Makmur, Dean Leo, Evgeny Klimov, Fedor Pavlov, Grigory Sokolov, I Belozerov, Igor Kovalyov, Irina Manzenko, Ivan Aleksandrov, l Kolesnikova, Maxim Magdalinin, Mihail Makarov, Mohamed Samy, Mourad El Keddani, Oleg Khmelevskiy, Oscar Ton, Pavel Vlasov, Petar Jacimovic, R Agafonov, S Doronina, Sebastian Seliga, Sergey Belyaev, Sergey Mityukov, Stanislav Polyanskiy, T Strelkova, Torben Melsted, V Isakov, Viktor Vasilevsky, Vladislav Tukhmenev, Vyacheslav Ognev, Yuriy Zaycev, Zhizhko Nadezhda
Edit data of subscription settings
Unsubscribe from the mailing list Sincerely,
Analysts Service | If you have any questions, you can make a phone call using one of the
InstaForex Toll free numbers right now:
|  | InstaForex Group is an international brand providing online trading services to the clients all over the world. InstaForex Group members include regulated companies in Europe, Russia and British Virgin Islands. This letter may contain personal information for access to your InstaForex trading account, so for the purpose of safety it is recommended to delete this data from the history. If you have received this letter by mistake, please contact InstaForex Customer Relations Department. |


Post a Comment
0Comments