| Elliott wave analysis of EUR/JPY for October 30, 2020 2020-10-30 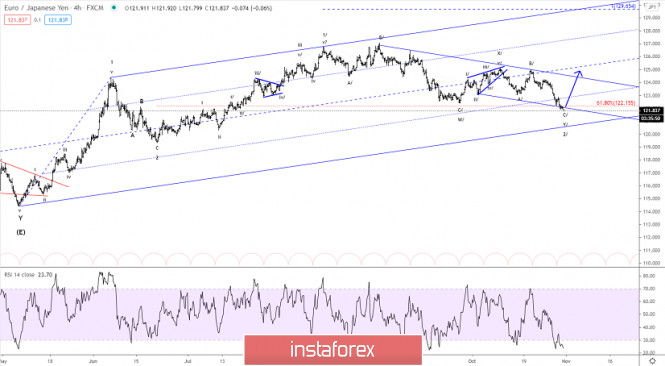
The risk-off sentiment continued to dominate the market yesterday as the coronavirus is raging in Europe. Versus EUR, JPY is gaining momentum amid risk aversion. Therefore, EUR/JPY decreased to 121.75. After a deeper decline, the pair may fall to the 78.6% corrective target of wave 1/ at 120.94 before wave 2/ is completed. In the short-term, we need a break above minor resistance at 122.25 and more importantly, a break above resistance at 123.39 to confirm that wave 2/ is completed and wave 3/ is in motion but until that the corrective trend lower will remain in force. R3: 123.39 R2: 122.72 R1: 122.25 Pivot: 121.92 S1: 121.75 S2: 121.45 S3: 120.94 Trading recommendation: Our stop at 121.75 was hit for a 50 pips loss. We will re-buy EUR at 121.00 or upon a break above 122.25 Elliott wave analysis of GBP/JPY for October 30, 2020 2020-10-30 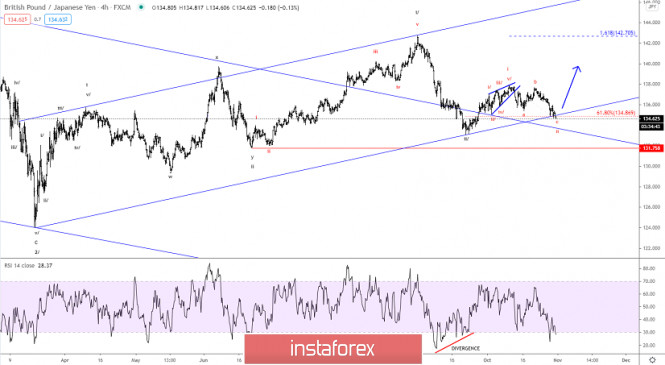
The risk-off sentiment continued to dominate the market yesterday as the coronavirus is raging in Europe. Versus GBP, JPY is gaining momentum amid risk aversion. Therefore, GBP/JPY fell to 134.50. After a deeper decline, the pair may dip to the 78.6% corrective target of red wave i at 134.11 before red wave ii finally is complete. In the short-term, we need a break above minor resistance at 135.38 and more importantly a break above resistance at 136.30 to confirm that red wave ii is completed and red wave iii is in motion but until that the corrective trend lower will remain in force. R3: 136.30 R2: 135.38 R1: 134.87 Pivot: 134.63 S1: 134.50 S2: 134.34 S3: 134.11 Trading recommendation: We are long GBP from 135.45 Analytics and trading signals for beginners. How to trade EUR/USD on October 30? Plan for opening and closing trades on Friday 2020-10-30 Hourly chart of the EUR/USD pair 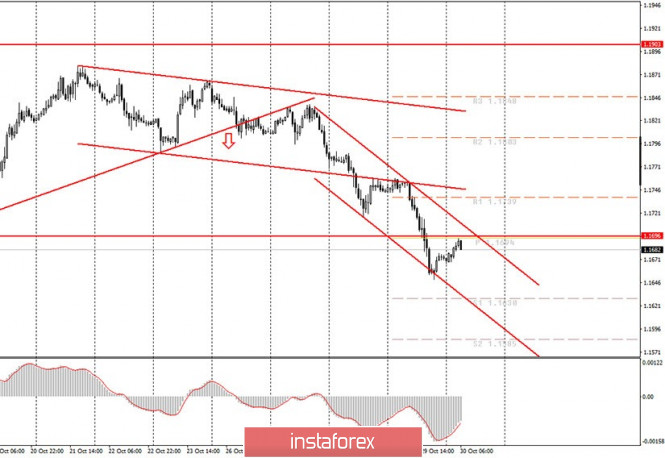 The EUR/USD pair began an upward correction last night, as we expected. Unfortunately, the movement that preceded it was so strong that even after a whole night of correction, the MACD indicator failed to recover to zero. Thus, if the euro/dollar pair wants to go back to moving down, the MACD indicator might respond late to this. However, in order to help traders, we also built a descending channel. We can say that the channel is just "one-time". It has too strong an angle of inclination, and such channels do not last for a long time. Therefore, at best, the pair will rebound off its upper border once, which will serve as a signal for new sell positions. We have two potential sell signals at once for the day. Take note that there is a third potential signal. As part of the correction, the price recovered to the 1.1696 level, which acted as the lower border of the horizontal channel for a long time. Thus, rebounding from this level can also provoke a resumption of downward movement. As for the fundamental background, we have quite important reports to wait for. In Europe, the most important indicator of GDP (Gross Domestic Product) will be released today, which, in fact, reflects the size of the economy. Yesterday's US GDP report was very strong, which led to a sharp rise in the dollar. Traders might significantly react to today's reports as well. However, the GDP indicator itself may not be as strong as the euro buyers would like. The European economy is expected to grow 9.4% q/q in the third quarter. And in the second quarter, it lost 11.8%. But even if the third quarter's forecast was equal to the losses in the second, it still would not mean that the economy has fully recovered. This is somewhat a mathematical paradox. Take any number and subtract 31% and then add 33%. Therefore, a result of + 9.4% in the third quarter may not impress market participants. If the forecast value is exceeded by at least a few percent (which is unlikely), then the euro could rise today.The eurozone will also release its inflation rate for October, which is forecast to remain unchanged at -0.3% y/y. If this report does not turn out to be much stronger than forecasts, then it will not provide any support for the euro. Only minor reports will be published today in the US, which are unlikely to attract the attention of most traders. Possible scenarios for October 30: 1) Buy positions on the EUR/USD pair are currently irrelevant. However, thanks to the new downward trend channel, buyers have more realistic opportunities to trade bullish in the near future. If the pair settles above the channel, then you can place buy positions while aiming for 1.1739 and 1.1803. 2) Trading for a fall remains relevant at this time, although the pair dropped 180 points in two days and corrected minimally. And so we expect a new sell signal from MACD, with which it may be quite late. Therefore, if novice traders see that MACD is very late, then you are advised to act at your own discretion. Rebounding from the 1.1696 level or the upper border of the channel can also be interpreted as a sell signal with targets at 1.1630 and 1.1585. On the chart: Support and Resistance Levels are the Levels that serve as targets when buying or selling the pair. You can place Take Profit near these levels. Red lines are the channels or trend lines that display the current trend and show in which direction it is better to trade now. Up/down arrows show where you should sell or buy after reaching or breaking through particular levels. The MACD indicator (14,22,3) consists of a histogram and a signal line. When they cross, this is a signal to enter the market. It is recommended to use this indicator in combination with trend lines (channels and trend lines). Important announcements and economic reports that you can always find in the news calendar can seriously influence the trajectory of a currency pair. Therefore, at the time of their release, we recommended trading as carefully as possible or exit the market in order to avoid a sharp price reversal. Beginners on Forex should remember that not every single trade has to be profitable. The development of a clear strategy and money management are the key to success in trading over a long period of time. EUR/USD: plan for the European session on October 30. COT reports. Euro drops on expectations of ECB easing of monetary policy 2020-10-30 To open long positions on EUR/USD, you need: The euro continued to fall against the US dollar yesterday, reaching another local low. A signal to sell the euro from the 1.1723 level appeared in the first half of the day. If you look at the 5-minute chart, you will see how the bulls protected this area in its first test, however, sellers actively returned the pair to the 1.1723 level, forming an entry point into short positions further along the trend. They are trying to buy on a rebound from the 1.1688 area, where I also recommended opening long positions. A signal appeared to sell the euro below the 1.1688 area, following European Central Bank President Christine Lagarde's press conference, the test of which is on the reverse side, which leads to selling EUR/USD. I marked all entry points on the chart. 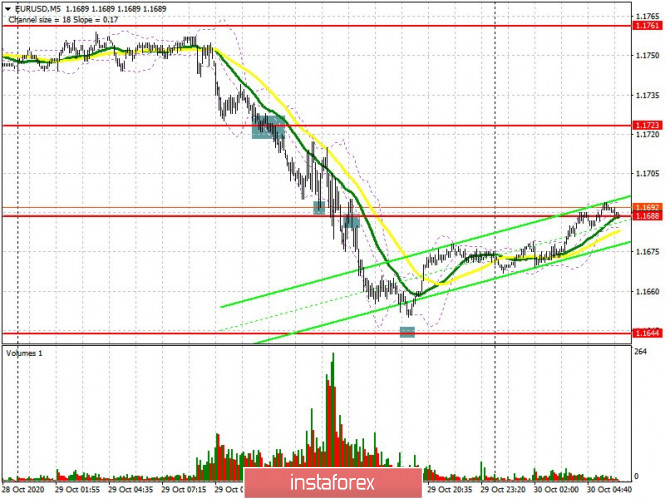 Bulls need to defend support at 1.1680 in the first half of the day, but there is little hope for it, since a rather large number of fundamental statistics for the eurozone countries will be released. The reports are expected to be bad, so the euro will be under pressure. You can buy from 1.1680 only if a false breakout is formed in order to go beyond and settle above the resistance of 1.1713, where the moving averages pass, playing on the side of sellers. Only a breakout of this level will strengthen the upward trend in EUR/USD and open a direct road to the high of 1.1754, where I recommend taking profits. If the bulls are not active in the support area of 1.1680, then it is best to postpone long positions until we have tested a low of 1.1651, subject to forming a false breakout there, or buy EUR/USD only for a rebound from the new local low of 1.1617, counting on an upward correction of 15 -20 points within the day. The Commitment of Traders (COT) report for October 20 recorded an increase in long positions and short ones. However, there were more of the latter, which led to an even greater decrease in the positive delta. Despite this, the buyers of risky assets believe in the continuation of the bull market, but prefer to act with caution, as there is no good news for the eurozone yet. Thus, long non-commercial positions increased from 228,295 to 229,878, while short non-commercial positions increased from 59,658 to 63,935. The total non-commercial net position decreased to 165,943, against 168,637 a week earlier.... However, the bullish sentiment for the euro remains rather high in the medium term. The more the euro falls against the US dollar at the end of this year, the more attractive it is for new investors. To open short positions on EUR/USD, you need: Sellers should protect resistance at 1.1713, just above which the moving averages pass, playing on the side of the bears. Considering that the trend is downward, it is better to expect that it will continue today, since there isn't much to expect from today's eurozone fundamental reports. Forming a false breakout in the 1.1713 area produces a new entry point for short positions, and the main target will be a breakout and being able to settle below the 1.1680 level. Testing it from the bottom up, similar to yesterday, creates an additional signal to open short positions in euros, which will lead to a larger sale in the area of a low of 1.1651. A breakthrough of this area and testing it from the bottom up will form a new sell signal and will open a direct road to the next target area of 1.1617, which is where I recommend taking profits. However, before opening short positions at the lows, make sure that there is no divergence on the MACD indicator, since it's the end of the month and sellers can take profits, which could cause the euro to grow. If the pair rises above 1.1713 and bears are not active, I recommend postponing short positions and selling the euro immediately on a rebound from the resistance of 1.1754, counting on a correction of 15-20 points within the day. 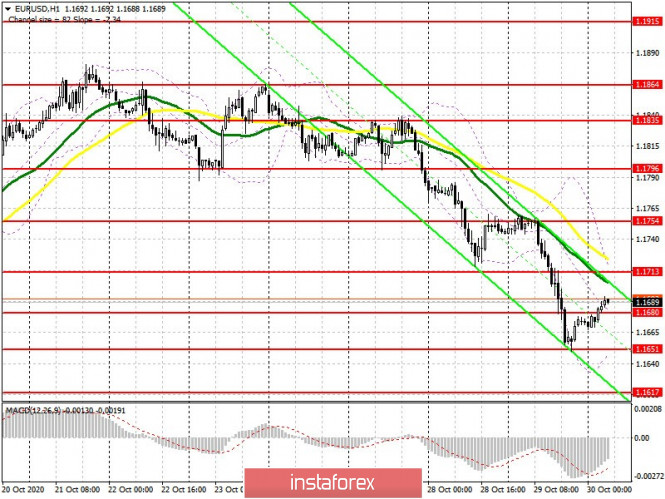 Indicator signals: Moving averages Trading is carried out below 30 and 50 moving averages, which indicates the presence of the bear market. Note: The period and prices of moving averages are considered by the author on the H1 hourly chart and differs from the general definition of the classic daily moving averages on the daily D1 chart. Bollinger Bands In case the euro falls, the lower border of the indicator in the 1.1640 area will act as a support. Growth will be limited by the upper level of the indicator in the 1.1715 area. Description of indicators - Moving average (moving average, determines the current trend by smoothing out volatility and noise). Period 50. It is marked in yellow on the chart.
- Moving average (moving average, determines the current trend by smoothing out volatility and noise). Period 30. It is marked in green on the chart.
- MACD indicator (Moving Average Convergence/Divergence — convergence/divergence of moving averages) Quick EMA period 12. Slow EMA period to 26. SMA period 9
- Bollinger Bands (Bollinger Bands). Period 20
- Non-commercial speculative traders, such as individual traders, hedge funds, and large institutions that use the futures market for speculative purposes and meet certain requirements.
- Long non-commercial positions represent the total long open position of non-commercial traders.
- Short non-commercial positions represent the total short open position of non-commercial traders.
- Total non-commercial net position is the difference between short and long positions of non-commercial traders.
GBP/USD: plan for the European session on October 30. COT reports. Pound continues to update weekly lows 2020-10-30 To open long positions on GBP/USD, you need: Buyers of the British pound were desperately fighting for support at 1.2919 and they even managed to form a signal to buy the pound from it in the afternoon. Take a look at the 5-minute chart. You can see how several false breakouts of the 1.2919 support formed a good entry point into long positions, the growth was worth around 25 points, after which the bulls fizzled out. Falling under the 1.2919 level closer to the middle of the US session and testing this level from the bottom up formed a signal to sell the pound, afterwards the pair fell by around 40 points. 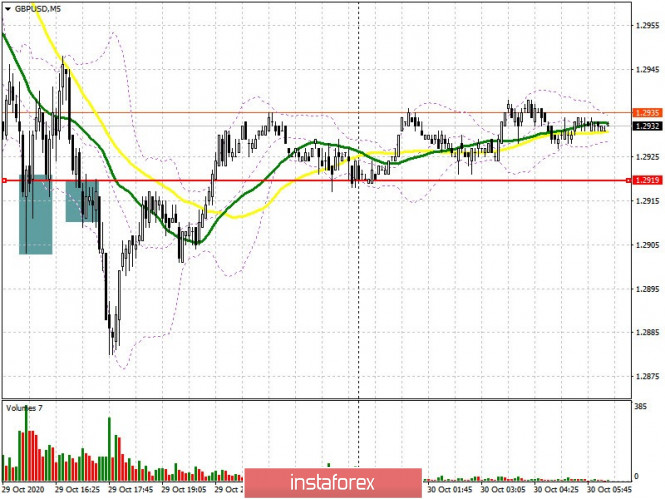 The technical picture has not changed much compared to yesterday. The lack of Brexit news weighs on both buyers and sellers. Buyers have a chance for a market reversal, and for this they need to prevent a breakout of support at 1.2917. Forming a false breakout on it will be the first signal to open long positions. If there is no activity there, I recommend postponing long deals until the 1.2865 low has been updated, which we did not reach yesterday. From there, you can open buy positions immediately on a rebound, counting on a correction of 20-30 points within the day. But it is possible to speak of a more probable recovery and a change in the trend once the pair has settled above the resistance of 1.2991, slightly below which the moving averages passes, playing on the side of the sellers of the pound.Testing the 1.2991 area on the reverse side forms a new entry point for long deals with the goal of updating highs of 1.3058 and 1.3120, where I recommend taking profits. The Commitment of Traders (COT) report for October 20 showed a reduction in short positions and a sharp increase in long positions. Long non-commercial positions rose from 36,195 to 39,836. At the same time, short non-commercial positions fell from 45,997 to 41,836. As a result, the negative value of the non-commercial net position slightly increased and reached -2,000, against - 9,802 a week earlier, which indicates that the sellers of the pound retain control and also shows their minimal advantage in the current situation. To open short positions on GBP/USD, you need: Bears aim to regain control of support at 1.2917. A breakout and being able to settle below this level will be a signal to open new short positions in sustaining the downward trend and with the main goal of updating a fairly large low of 1.2865, which has already been tested four times this month. A breakthrough of this range will cause GBP/USD to drop and reach a low of 1.2807 and 1.2749, where I recommend taking profits. Negative Brexit news and the absence of a trade deal could increase the pressure on the pair. In case of an upward correction, you can pay attention to forming a false breakout in the resistance area of 1.2991, which will be a signal to sell the pound in order to continue the current trend. 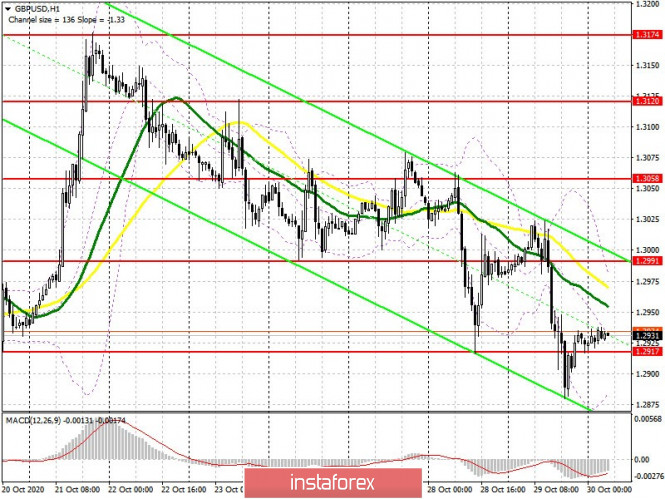 Indicator signals: Moving averages Trading is carried out slightly below the 30 and 50 moving averages, which indicates that the pair is still under pressure. Note: The period and prices of moving averages are considered by the author on the H1 hourly chart and differs from the general definition of the classic daily moving averages on the daily D1 chart. Bollinger Bands A breakout of the upper border of the indicator in the 1.2965 area will lead to a new wave of growth of the pound. A breakout of the lower border of the indicator in the 1.2885 area will increase the pressure on the pair. Description of indicators - Moving average (moving average, determines the current trend by smoothing out volatility and noise). Period 50. It is marked in yellow on the chart.
- Moving average (moving average, determines the current trend by smoothing out volatility and noise). Period 30. It is marked in green on the chart.
- MACD indicator (Moving Average Convergence/Divergence — convergence/divergence of moving averages) Quick EMA period 12. Slow EMA period to 26. SMA period 9
- Bollinger Bands (Bollinger Bands). Period 20
- Non-commercial speculative traders, such as individual traders, hedge funds, and large institutions that use the futures market for speculative purposes and meet certain requirements.
- Long non-commercial positions represent the total long open position of non-commercial traders.
- Short non-commercial positions represent the total short open position of non-commercial traders.
- Total non-commercial net position is the difference between short and long positions of non-commercial traders.
Trading plan for the EUR/USD pair on October 30. New peak of COVID-19 incidence - around 545 thousand new cases a day. 2020-10-30 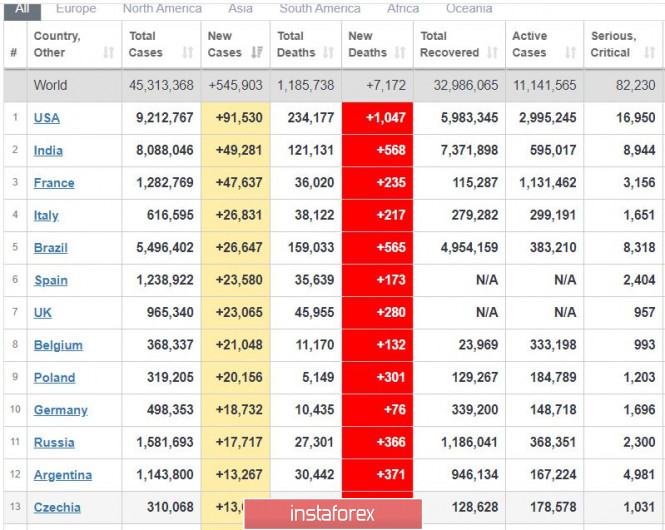
A new peak in coronavirus incidence was recorded recently- around 545 thousand new cases a day worldwide. 91 thousand of it came from the United States, which further decreases the chance of Donald Trump winning in the upcoming US elections. Infections continue to increase as well in many parts of Europe. Against this background, everyone is advised to follow health protocols and, if possible, avoid crowded places, especially in enclosed spaces. 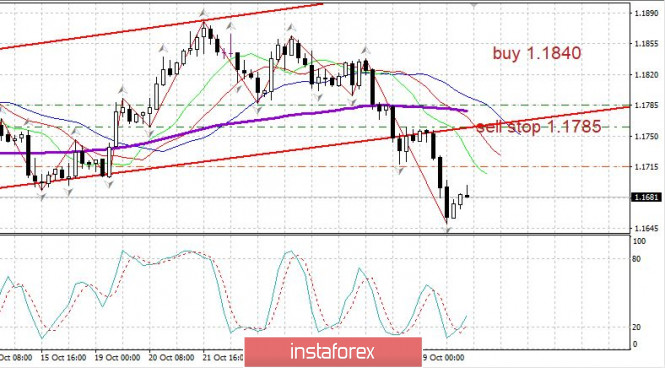
EUR/USD - The euro fell sharply on Thursday after very strong economic data from the United States. According to a report, US GDP grew 33% in the 3rd quarter, covering the 30% drop observed in the last quarter. The US Department of Commerce said the US economy has fully recovered from the downturn caused by the lockdown. At the same time, employment in the US also increased by 700 thousand. Keep short positions from 1.1785, however, there is a very strong support at 1.1645 ahead, so a rebound is possible. Open long positions from 1.1760. Straightforward trading recommendations on EUR/USD for October 30, 2020 2020-10-30  Yesterday, the euro/dollar pair broke the support level of 1.1700 to reach the next support level located at 1.1650. After that, the pair showed a rise. Yesterday, there were several signals that pointed to the development of the downward movement. Let's take a close look at them. First of all, I would like to emphasize a gradual downward movement of the price that began last week. This proved that the number of short deals (sell deals) exceeded the number of long deals. We also should take into account that the euro/dollar pair broke such levels as 1.1810 and 1.1700. This led to the strengthening of the descending interest. From October 28 to October 29, the pair was hovering within the levels of 1.1743/1.1760. A break of the lower limit of the range became a signal to open sell positions. Notably, news flow also has a significant influence on the single currency. Thus, the skyrocketing number of new virus cases made the EU introduce new restrictive measures. This will surely have a negative effect on the economy. At the moment, we can see that the recovery process from the support level of 1.1650 has almost come to an end. Bearish sentiment still prevails in the market. It is quite possible that bears' target is to reach the low of 1.1650 logged yesterday. This level also acts as support. If the euro/dollar pair breaks the mentioned level, it may fall even deeper to the support level of 1.1612 that was hit in September. Summing up, we can say that market participants expect the euro to go on losing in value. 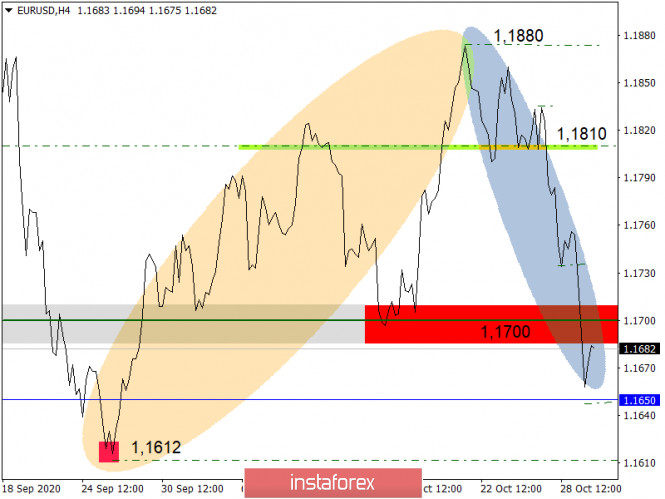 Technical Analysis of GBP/USD for October 30, 2020 2020-10-30 Technical Market Outlook: The GBP/USD pair has hit the main channel lower line located at the level of 1.2880. The bounce from this level was rather shallow, the price hit 1.2938 and reversed again. The momentum is still weak and negative, so lower levels are in view. The next target for bears is seen at the level of 1.2868 and 1.2848. The nearest technical resisance is seen at the level of 1.2982. The weekly time frame candle is now down and engulfs the previous up candle, so the bears are in control of the market. Weekly Pivot Points: WR3 - 1.3465 WR2 - 1.3320 WR1 - 1.3185 Weekly Pivot - 1.3039 WS1 - 1.2902 WS2 - 1.2757 WS3 - 1.2620 Trading Recommendations: The GBP/USD pair is in the down trend on the monthly time frame, but the recent bounce from the low at 1.1411 made in the middle of March 2020 loos very strong and might be a reversal swing. In order to confirm the trend change, the bulls have to break through the technical resistance seen at the level of 1.3518. All the local corrections should be used to enter a buy orders as long as the level of 1.2674 is not broken. 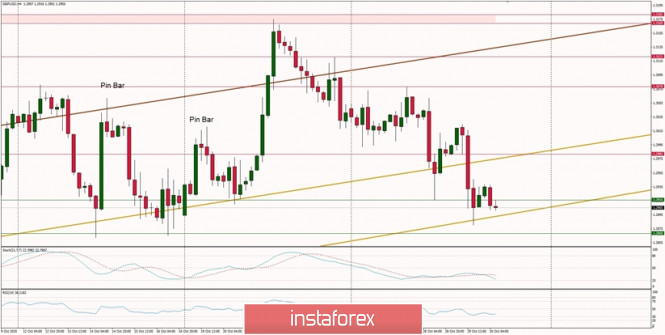
Technical Analysis of EUR/USD for October 30, 2020 2020-10-30 Technical Market Outlook: The EUR/USD pair has hit the level of 1.1648, which is the short-term key technical support, together with the level of 1.1655. The momentum is still weak and negative despite the oversold market conditions at the H4 time frame chart. The nearest intraday resistance is seen at the level of 1.1696. The weekly candle is down and it is bigger than last week up candle, so the bears are still in control of the market. The next target for bears is seen at the level of 1.1612. Weekly Pivot Points: WR3 - 1.2123 WR2 - 1.1991 WR1 - 1.1943 Weekly Pivot - 1.1823 WS1 - 1.1766 WS2 - 1.1638 WS3 - 1.1589 Trading Recommendations: Since the middle of March 2020 the main trend is on EUR/USD pair has been up, which can be confirmed by almost 10 weekly up candles on the weekly time frame chart and 4 monthly up candles on the monthly time frame chart. The recent correction towards the level of 1.1612 seems to be completed and now market is ready for another wave up. This means any local corrections should be used to buy the dips until the key technical support is broken. The key long-term technical support is seen at the level of 1.1445. The key long-term technical resistance is seen at the level of 1.2555. 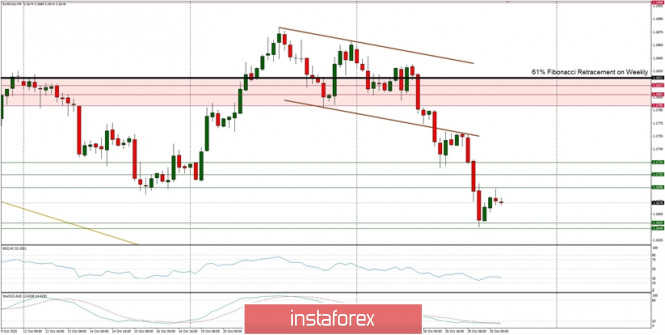
EUR/USD: The world's leading economies have clearly lost their bullish momentum in the 4th quarter, thereby putting pressure on risky assets. Expect a sharp decline in the European currency. 2020-10-30 The recent statements from the European Central Bank hints of possible policy changes in December. To add to that, the EU economy has a high chance of showing greater growth than in the 3rd quarter, however, it does not reduce market expectations regarding the expansion of assistance programs from the ECB. New stimulus measures will directly hit the purchasing activity of the European currency, the demand for which, if not much will fall, will certainly be significantly lower than in the summer period, when everyone believed in a more active economic recovery after the pandemic.  At its meeting yesterday, the ECB gave a clear signal that, if necessary, it will adjust its stimulus measures, as well as prepare new forecasts for economic growth. ECB President Christine Lagarde, during her speech, talked a lot about the current deteriorating situation with the coronavirus, which poses a lot of threat to growth prospects. Many already see that economic recovery has started to slow down, and the short-term prospects have clearly worsened after the recent quarantine measures taken by the leading economies of the eurozone. And although Lagarde's optimism that the EU economy has regained half of what it lost in the 3rd quarter is encouraging, the significant weakening of economic activity in the 4th quarter will clearly not benefit the GDP, which by the end of the year will not be able to recover to the pre-crisis level. In terms of future policy changes, Lagarde said that ambitious and coordinated fiscal stimulus is now critical, thus, she emphasized the importance of the recovery fund being available at the very beginning of next year. This is because the balance of risks is already shifted downward, and this requires a revision of the scale and duration of stimulus measures. At the end of her speech, Lagarde also mentioned that she is monitoring the exchange rate of the euro very carefully, since a more active strengthening will hinder the pace of economic recovery. According to her, the central bank is ready to intervene if necessary. With regards to economic reports, the latest data on US jobless claims supported the dollar in rising in the markets, especially since the figures continue to improve. The recent report by the US Department of Labor said initial jobless claims for the week of October 18-24 fell by 40,000 to 751,000, the lowest record since the start of the coronavirus pandemic. 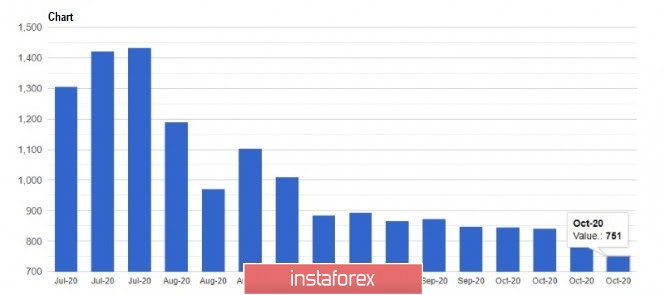 As for the US GDP for the 3rd quarter, an unprecedented growth was seen, which pleased not only the economists but also traders. The report published by the US Department of Commerce said the GDP grew by 7.4% in the 3rd quarter, and increased by 33.1% per annum. Such a powerful rise is directly related to the lifting of quarantine measures in the middle of this year, as well as the beginning of the full functioning of a number of companies and enterprises. However, the economic growth rate is still 3.5% lower than in the 4th quarter of 2019, and for a full economic recovery in the 4th quarter of this year, an increase of 15.2% per annum is required. But considering the current deteriorating situation with the coronavirus, this option is highly unlikely. 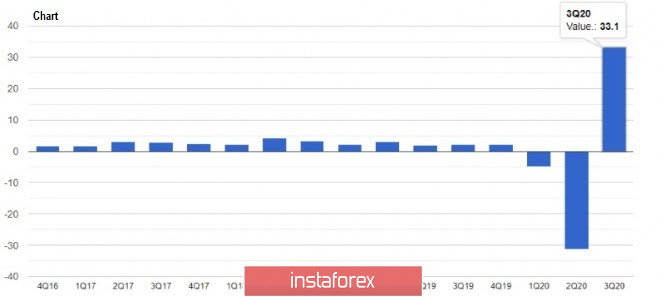 About the EUR/USD pair, there is a high chance that the quote will close in a sideways channel today, mainly because first, the bears will try to break below 1.1650, which will ultimately fail. Then, the bulls will try to break above 1.1710, however, their efforts will meet active resistance from the bears, who, as mentioned earlier, are betting on the further decline in risky assets. Indicator Analysis. Daily review for EUR/USD pair 10/30/20 2020-10-30 Trend analysis (Fig. 1). Today, the market will try to go up from the level of 1.1673 (closing of yesterday's daily candle) with the target of 1.1702 - the retracement level of 23.6% (blue dotted line). In case of testing this level, there will be a work up to the level of 1.1760 - the retracement level of 38.2% (blue dotted line). 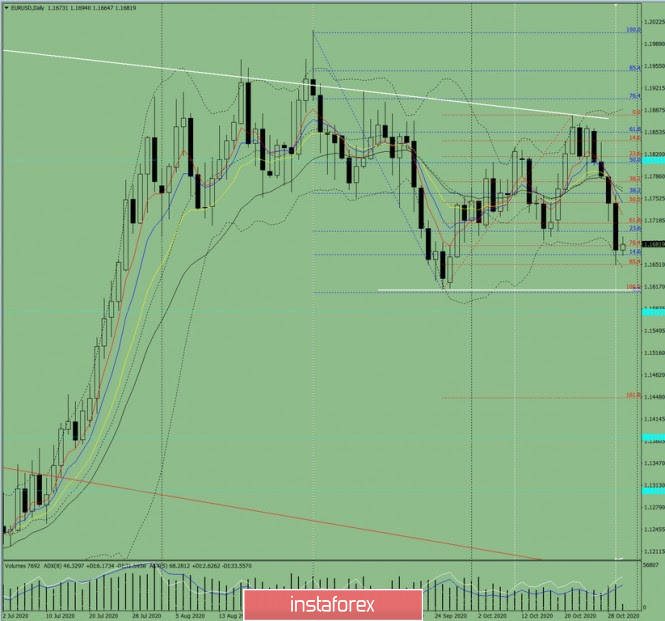 Figure: 1 (daily chart). Comprehensive Analysis: - Indicator Analysis - up
- Fibonacci Levels - up
- Volumes - up
- Candle Analysis - up
- Trend Analysis - up
- Bollinger Bands - up
- Weekly Chart - up
General conclusion: Today, the price will try to go up from the level of 1.1673 (closing of yesterday's daily candle) with the goal of 1.1702 - a pullback level of 23.6% (blue dotted line). If this level is tested, there will be a work up to the level of 1.1760 - a pullback level of 38.2% (blue dotted line). Alternative scenario: from the level of 1.1673 (closing of yesterday's daily candle), it may continue to go down with the goal of 1.1651 - a pullback level of 85.4% (red dotted line). If this level is tested, there will be a work down to the level of 1.1612 - the lower fractal (candle from 09/25/2020). Indicator analysis. Daily review on GBP/USD for October 30, 2020 2020-10-30 Trend analysis (Fig. 1). Today, the market from the level of 1.2929 (closing of yesterday's daily candlestick) will attempt to continue moving down with the goal of 1.2868, which is a pullback level of 61.8% (red dotted line). When this level is reached, the price may resume moving down to the next target of 1.2794, which is a pullback level of 76.4% (red dotted line). 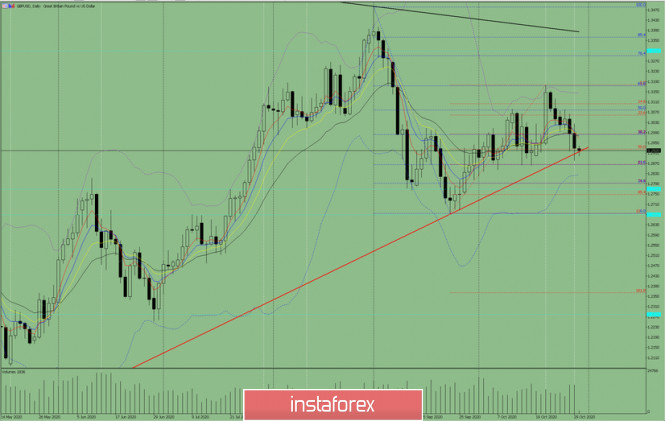
Figure 1 (Daily chart). Comprehensive analysis: - Indicator analysis - down
- Fibonacci levels - down
- Volumes - down
- Candlestick analysis - down
- Trend analysis - up
- Bollinger bands - down
- Weekly chart - up
General conclusion: Today, the price from the level of 1.2929 (closing of yesterday's daily candlestick) will attempt to continue moving down with the goal of 1.2868, which is a pullback level of 61.8% (red dotted line). When this level is reached, the price may continue to move down to the next target of 1.2794, which is a pullback level of 76.4% (red dotted line). Alternative scenario: from the level of 1.2929 (closing of yesterday's daily candlestick), the price will start moving up to reach the pullback level of 38.2% - 1.2983 (blue dotted line). When testing this level, there will be a continuation of the upward movement to the next target 1.3078, which is a pullback level of 50.0% (blue dotted line). Technical analysis of USD/CHF for September 31, 2020 2020-10-30 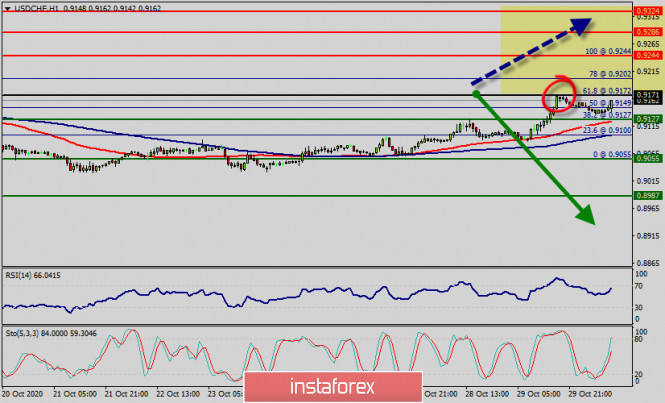 Overview: Resistance and support of the USD/CHF pair are set at 0.9244 and 0.9171 respectively. As known, Fibonacci retracement is used to determine accurate psychological levels of support and resistance. But it should be noted that the period of time should be taken into account, so in the daily chart the price has still moved above 61.8% Fibonacci retracement levels (0.9171). Additionally, the price is in a bullish channel now. Amid the previous events, the pair is still in a uptrend. From this point, the USD/CHF pair is continuing in a bullish trend from the new resistance of 0.9171. The RSI is still signaling that the trend is upward as it remains strong above the moving average (100). This suggests the pair will probably go up in coming days. Therefore, forecast for today will be in the following form: Buy above 0.9171 with the first target at 0.9287, it might resume to the 0.9324 level in coming days. On the other hand, if the price closes below the minor support, the best location for the stop loss order is seen below 0.9127; hence, the price will fall into the bearish market in order to go further towards the strong support at 1.4122 to test it again. Furthermore, the level of 0.8987 will form a double bottom. Stop losses should be placed below 0.8987 (in case of buying at the above the level of 0.9171).
Author's today's articles: Torben Melsted  Born in November 1962. Graduated from CBS, got Diploma in Finance. Began trading on Forex in 1986 and since that time held various positions such as advising clients, hedging client flows on FX and commodity markets. Also worked for major corporations as Financial Risk Manager. Uses Elliott wave analysis in combination with classic technical analysis, and has been using a Calmar Ratio of 5.0 for over 3 years. Has his own blog, where he uses Elliott wave and technical analysis on all financial markets. Born in November 1962. Graduated from CBS, got Diploma in Finance. Began trading on Forex in 1986 and since that time held various positions such as advising clients, hedging client flows on FX and commodity markets. Also worked for major corporations as Financial Risk Manager. Uses Elliott wave analysis in combination with classic technical analysis, and has been using a Calmar Ratio of 5.0 for over 3 years. Has his own blog, where he uses Elliott wave and technical analysis on all financial markets. Stanislav Polyanskiy  Graduated from Odessa State Economic University. On Forex since 2006. Writes analytical reviews about international financial markets for more than 3 years. Worked as a currency analyst in different finance companies for a long time including the biggest companies of Russia and Ukraine. Graduated from Odessa State Economic University. On Forex since 2006. Writes analytical reviews about international financial markets for more than 3 years. Worked as a currency analyst in different finance companies for a long time including the biggest companies of Russia and Ukraine. Maxim Magdalinin  In 2005 graduated from the Academy of the Ministry of Internal Affairs of the Republic of Belarus, law faculty. Worked as a lawyer for three years in one of the biggest country's company. Besides the trading, he develops trading systems, writes articles and analytical reviews. Works at stock and commodity markets explorations. On Forex since 2006. In 2005 graduated from the Academy of the Ministry of Internal Affairs of the Republic of Belarus, law faculty. Worked as a lawyer for three years in one of the biggest country's company. Besides the trading, he develops trading systems, writes articles and analytical reviews. Works at stock and commodity markets explorations. On Forex since 2006. Mihail Makarov  - - Vladislav Tukhmenev  Vladislav graduated from Moscow State University of Technologiy and Management. He entered the forex market in early 2008. Vladislav is a professional trader, analyst, and manager. He applies a whole gamut of analysis – technical, graphical, mathematical, fundamental, and candlestick analysis. Moreover, he forecasts the market movements using his own methods based on the chaos theory. Vladimir took part in development of trading systems devoted to fractal analysis. In his free time, Vladimir blogs about exchange markets. Hobbies: active leisure, sporting shooting, cars, design, and marketing. "I do not dream only of becoming the best in my field. I also dream about those who I will take with me along the way up." Vladislav graduated from Moscow State University of Technologiy and Management. He entered the forex market in early 2008. Vladislav is a professional trader, analyst, and manager. He applies a whole gamut of analysis – technical, graphical, mathematical, fundamental, and candlestick analysis. Moreover, he forecasts the market movements using his own methods based on the chaos theory. Vladimir took part in development of trading systems devoted to fractal analysis. In his free time, Vladimir blogs about exchange markets. Hobbies: active leisure, sporting shooting, cars, design, and marketing. "I do not dream only of becoming the best in my field. I also dream about those who I will take with me along the way up." Sebastian Seliga  Sebastian Seliga was born on 13th Oсtober 1978 in Poland. He graduated in 2005 with MA in Social Psychology. He has worked for leading financial companies in Poland where he actively traded on NYSE, AMEX and NASDAQ exchanges. Sebastian started Forex trading in 2009 and mastered Elliott Wave Principle approach to the markets by developing and implementing his own trading strategies of Forex analysis. Since 2012, he has been writing analitical reviews based on EWP for blogs and for Forex websites and forums. He has developed several on-line projects devoted to Forex trading and investments. He is interested in slow cooking, stand-up comedy, guitar playing, reading and swimming. "Every battle is won before it is ever fought", Sun Tzu Sebastian Seliga was born on 13th Oсtober 1978 in Poland. He graduated in 2005 with MA in Social Psychology. He has worked for leading financial companies in Poland where he actively traded on NYSE, AMEX and NASDAQ exchanges. Sebastian started Forex trading in 2009 and mastered Elliott Wave Principle approach to the markets by developing and implementing his own trading strategies of Forex analysis. Since 2012, he has been writing analitical reviews based on EWP for blogs and for Forex websites and forums. He has developed several on-line projects devoted to Forex trading and investments. He is interested in slow cooking, stand-up comedy, guitar playing, reading and swimming. "Every battle is won before it is ever fought", Sun Tzu Pavel Vlasov  No data No data Sergey Belyaev  Born December 1, 1955. In 1993 graduated from Air Force Engineering Academy. In September 1999 started to study Forex markets. Since 2002 has been reading lectures on the technical analysis . Is fond of research work. Created a personal trading system based on the indicator analysis. Authored the book on technical analysis "Calculation of the next candlestick". At present the next book is being prepared for publishing "Indicator Analysis of Forex Market. Trading System Encyclopedia". Has created eleven courses on indicator analysis. Uses classical indicators. Works as a public lecturer. Held numerous seminars and workshops presented at international exhibitions of financial markets industry. Is known as one of the best specialists in the Russian Federation researching indicator analysis. Born December 1, 1955. In 1993 graduated from Air Force Engineering Academy. In September 1999 started to study Forex markets. Since 2002 has been reading lectures on the technical analysis . Is fond of research work. Created a personal trading system based on the indicator analysis. Authored the book on technical analysis "Calculation of the next candlestick". At present the next book is being prepared for publishing "Indicator Analysis of Forex Market. Trading System Encyclopedia". Has created eleven courses on indicator analysis. Uses classical indicators. Works as a public lecturer. Held numerous seminars and workshops presented at international exhibitions of financial markets industry. Is known as one of the best specialists in the Russian Federation researching indicator analysis. Mourad El Keddani  Was born in Oujda, Morocco. Currently lives in Belgium. In 2003 obtained B.S. in Experimental Sciences. In 2007 obtained a graduate diploma at Institut Marocain Specialise en Informatique Applique (IMSIA), specialty – Software Engineering Analyst. In 2007–2009 worked as teacher of computer services and trainer in a professional school specializing in computer technologies and accounting. In 2005 started Forex trading. Authored articles and analytical reviews on Forex market on Forex websites and forums. Since 2008 performs Forex market research, and develops and implements his own trading strategies of Forex analysis (especially in Forex Research & Analysis, Currency Forecast, and Recommendations and Analysis) that lies in: Numerical analysis: Probabilities, equations and techniques of applying Fibonacci levels. Classical analysis: Breakout strategy and trend indicators. Uses obtained skills to manage traders' accounts since 2009. In April 2009 was certified Financial Technician by the International Federation of Technical Analysts. Winner of several social work awards: Education Literacy and Non-Formal Education (in Literacy and Adult Education in The National Initiative for Human Development). Was born in Oujda, Morocco. Currently lives in Belgium. In 2003 obtained B.S. in Experimental Sciences. In 2007 obtained a graduate diploma at Institut Marocain Specialise en Informatique Applique (IMSIA), specialty – Software Engineering Analyst. In 2007–2009 worked as teacher of computer services and trainer in a professional school specializing in computer technologies and accounting. In 2005 started Forex trading. Authored articles and analytical reviews on Forex market on Forex websites and forums. Since 2008 performs Forex market research, and develops and implements his own trading strategies of Forex analysis (especially in Forex Research & Analysis, Currency Forecast, and Recommendations and Analysis) that lies in: Numerical analysis: Probabilities, equations and techniques of applying Fibonacci levels. Classical analysis: Breakout strategy and trend indicators. Uses obtained skills to manage traders' accounts since 2009. In April 2009 was certified Financial Technician by the International Federation of Technical Analysts. Winner of several social work awards: Education Literacy and Non-Formal Education (in Literacy and Adult Education in The National Initiative for Human Development).
Languages: Arabic, English, French and Dutch.
Interests: Algorithm, Graphics, Social work, Psychology and Philosophy.
Subscription's options management Theme's:
Fundamental analysis, Fractal analysis, Wave analysis, Technical analysis, Stock Markets
Author's :
A Zotova, Aleksey Almazov, Alexander Dneprovskiy, Alexandr Davidov, Alexandros Yfantis, Andrey Shevchenko, Arief Makmur, Dean Leo, Evgeny Klimov, Fedor Pavlov, Grigory Sokolov, I Belozerov, Igor Kovalyov, Irina Manzenko, Ivan Aleksandrov, l Kolesnikova, Maxim Magdalinin, Mihail Makarov, Mohamed Samy, Mourad El Keddani, Oleg Khmelevskiy, Oscar Ton, Pavel Vlasov, Petar Jacimovic, R Agafonov, S Doronina, Sebastian Seliga, Sergey Belyaev, Sergey Mityukov, Stanislav Polyanskiy, T Strelkova, Torben Melsted, V Isakov, Viktor Vasilevsky, Vladislav Tukhmenev, Vyacheslav Ognev, Yuriy Zaycev, Zhizhko Nadezhda
Edit data of subscription settings
Unsubscribe from the mailing list Sincerely,
Analysts Service | If you have any questions, you can make a phone call using one of the
InstaForex Toll free numbers right now:
|  | InstaForex Group is an international brand providing online trading services to the clients all over the world. InstaForex Group members include regulated companies in Europe, Russia and British Virgin Islands. This letter may contain personal information for access to your InstaForex trading account, so for the purpose of safety it is recommended to delete this data from the history. If you have received this letter by mistake, please contact InstaForex Customer Relations Department. |


Post a Comment
0Comments